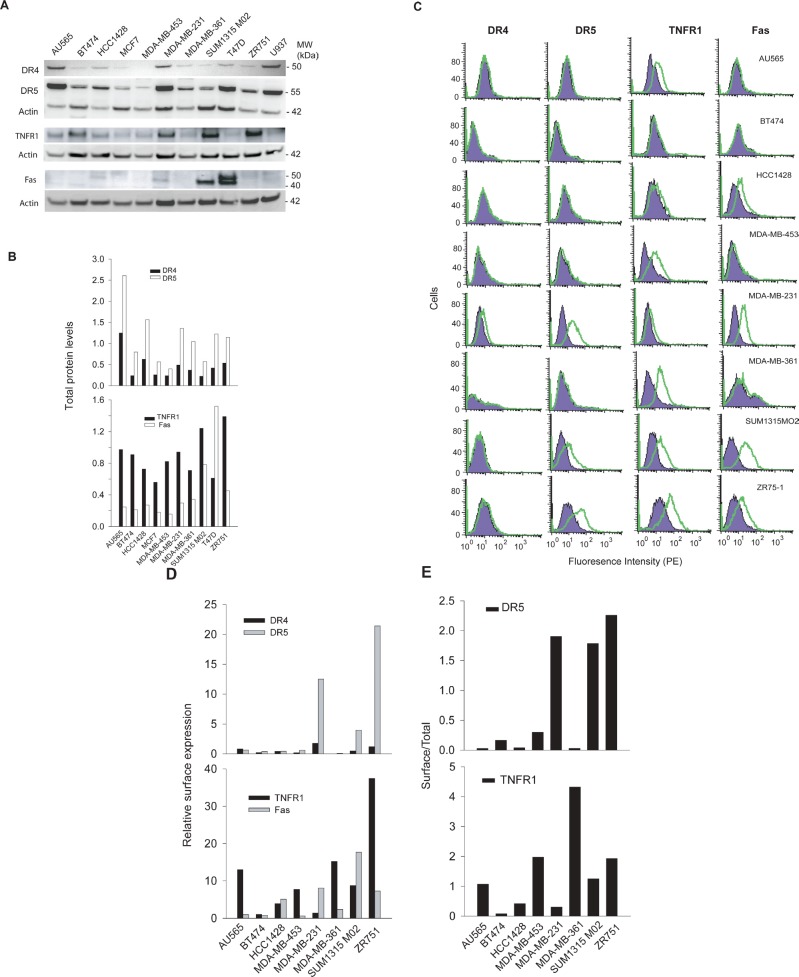
Figure 1. DR expression in breast cancer cell lines.
A, Protein expression levels of DR4, DR5, TNFR1, and Fas were analyzed by western blotting using antibodies specific to each receptor. B, The relative DR protein levels were estimated by densitometry analysis of the blots in A and normalized to the corresponding actin intensities. A monocyte cell line U937 was included as a control. C, DR expression on cell surface was determined by flow cytometry analysis after staining with PE-conjugated antibodies specific to each receptor (open histograms) or with isotype-matched control IgG (shadowed histogram). The presence of a DR on cell surface is indicated by the right-shift in fluorescence intensity compared to the control IgG-PE. D, Relative surface protein levels of DRs were estimated by the formula: [Mean (PE-DR) – Mean (PE-IgG)]/Mean (PE-IgG). E, Ratios of surface DR5 and TNFR1 expressions in 1D compared to their total protein levels as shown in 1B.

