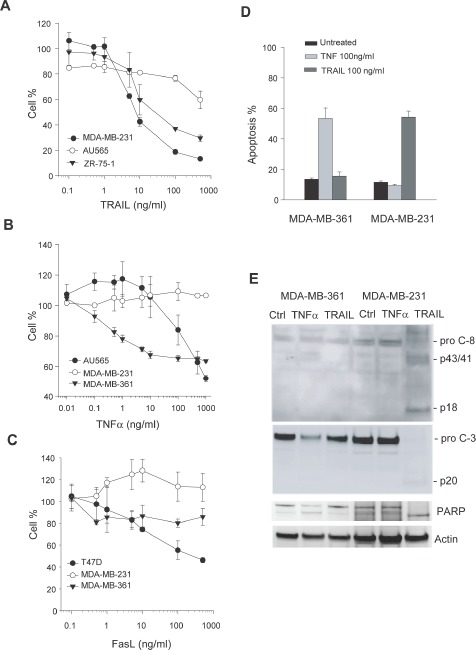
Figure 3. Cellular sensitivity to apoptosis induction by death ligands.

A-C, Representative dose-response curves in the indicated cell lines treated with increasing concentrations of rhTRAIL, rhTNFα, and rhFasL, respectively, at 37 C for 48 h. Cell viability was determined by a MTS assay (see Materials & Methods). GI50 values were derived from the response curves and summarized in Table 1. D-E, Apoptotic response to rhTRAIL or rhTNF in the indicated cell lines. Cells were treated with 100 ng/ml of rhTRAIL or 100 ng/ml of rhTNF at 37 C for 24 h, and analyzed by flow cytometry (D) and western blotting for caspase 3 and 8 (E). Activation of caspases was indicated by a decline in the pro-caspase forms, a simultaneous accumulation of cleaved fragments (p43/41 and p20), and the cleavage of a caspase substrate poly ADP ribose polymerase (PARP).
