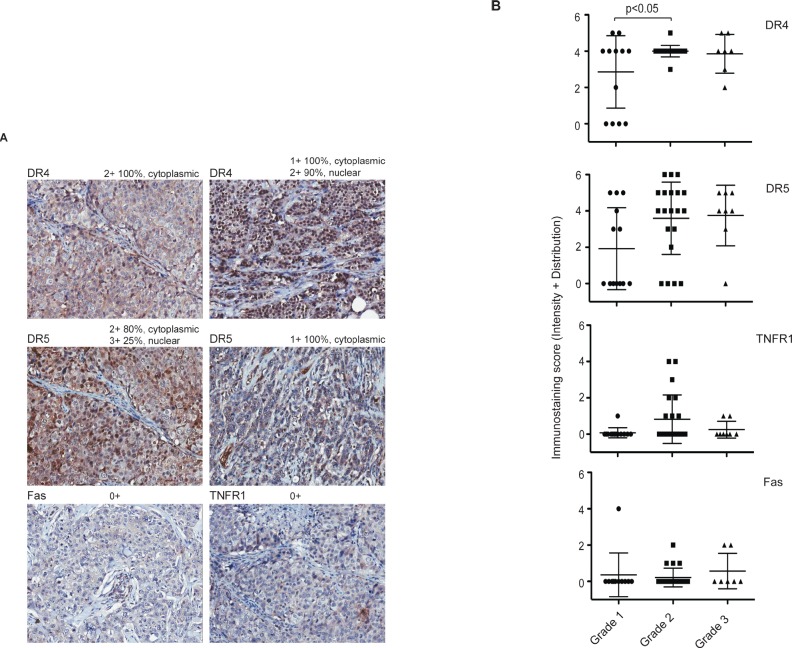
Figure 4. Immunohistochemical staining of DRs in primary breast tumors.
A. Representative images of DR4, DR5, TNFR1, and Fas immunohistochemical staining of human breast cancer tissue array (BR1005, US Biomax) with anti-DR4 (R&D Systems), anti-DR5 (ENZO), anti-Fas (Vector) or anti-TNFR1 (R&D). Magnification, × 200. B. Immuno-staining scores were plotted against tumor grades. Tissue samples were analyzed by a certified pathologist and given semi-quantitative scores based on staining intensity [0- no staining, 1- weak staining, 2- medium staining and 3- strong staining] and distribution [0 (<10% of cancer cells), 1 (10-40%), 2 (41-70%), and 3 (>70%)]. The final staining score (y-axis) was given by adding the intensity and the distribution for each sample. The average combined staining scores (intensity + distribution, ranging 0 to 6) are plotted (mean ± SD).

