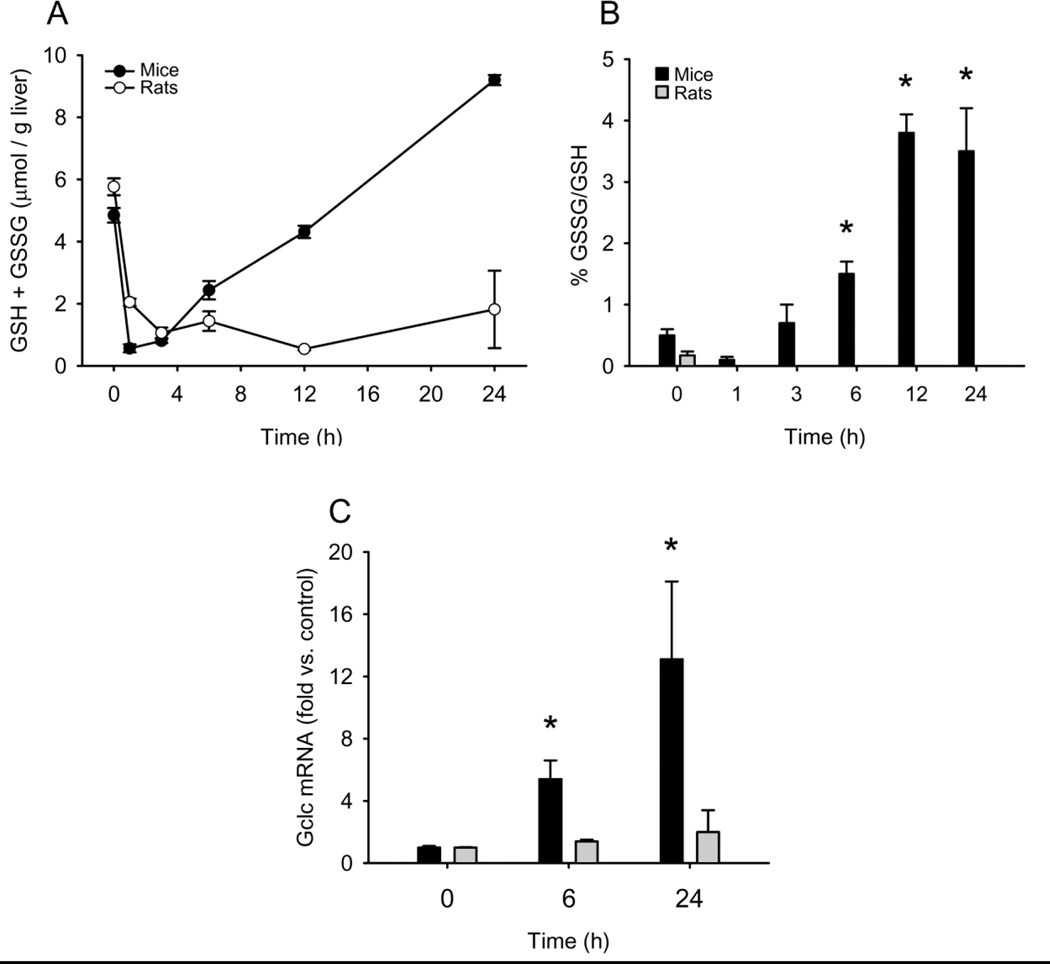
Figure 2.
Liver glutathione (GSH) and glutathione disulfide (GSSG) in mice and Fischer 344 rats after APAP treatment. Mice and rats were treated i.p. with 300 mg APAP/kg body weight or 1 g APAP/kg, respectively. At the indicated times, the animals were sacrificed and liver samples were flash frozen for later analysis of GSH and GSSG. (A) Total GSH levels. (B) GSSG-to-GSH ratio shown as a percentage. (C) mRNA levels of glutamate-cysteine ligase (gclc). Data are expressed as mean ± SEM for n = 3–4 animals per group. *P < 0.05 (compared to t=0).

