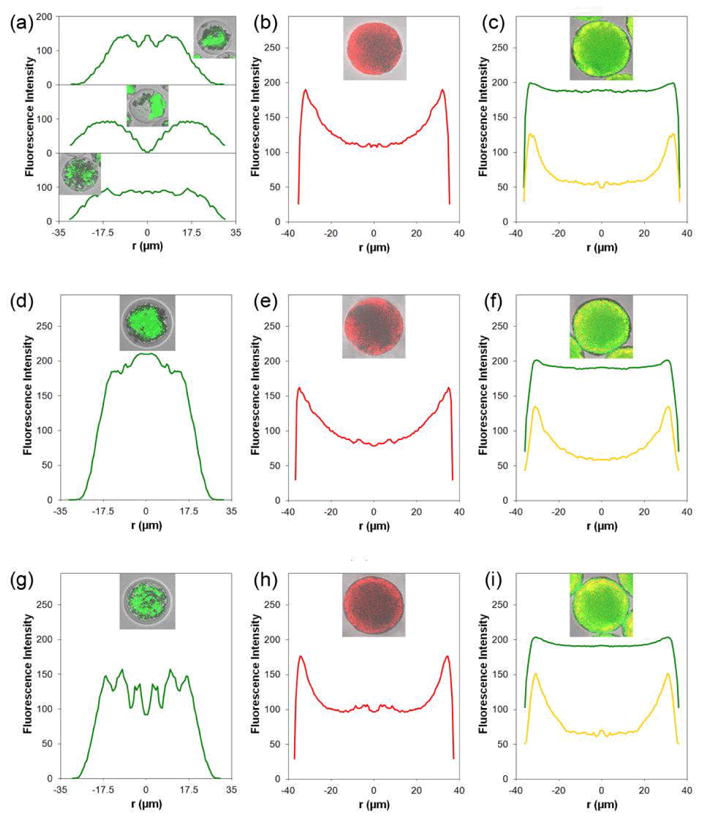
Figure 3.

Radially averaged fluorescence intensity profiles of doxorubicin and/or chi-p53 nanoparticles in representative double-walled PLA(PLGA) microspheres. The inserts are the confocal images captured at the centerline of the microspheres. (a), (d) and (g) are the profiles of doxorubicin (green) for formulation B microspheres with increasing molecular weights of PLA shell layer, i.v. = 0.37, 0.70 and 1.05 dL/g, respectively. (b), (e) and (h) are the profiles of chi-p53 nanoparticles (red) for formulation C microspheres with increasing molecular weights of PLA shell layer, i.v. = 0.37, 0.70 and 1.05 dL/g, respectively. (c), (f) and (i) are the profiles of doxorubicin (green) and chi-p53 nanoparticles (yellow) for formulation D microspheres with increasing molecular weights of PLA shell layer, i.v. = 0.37, 0.70 and 1.05 dL/g, respectively.
