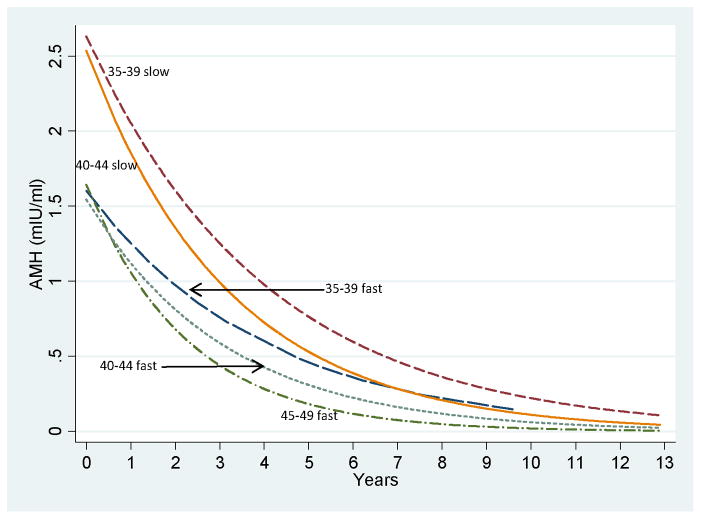
Figure 1.
AMH rate of decline over the study interval for women with baseline AMH >=1.0 ng/mL in 5 subgroups. Subgroups are the following (starting at lower left): ages 45–49 years, fast rate of decline; 40–44 years, fast rate of decline; 35–39 years, fast rate of decline; 40–44 years, slow rate of decline; 35–39 years, slow rate of decline. The subgroups with AMH <1.0 ng/mL at baseline had little additional AMH decline and the curves of these subgroups were nearly identical (not shown).

