Fig 5.
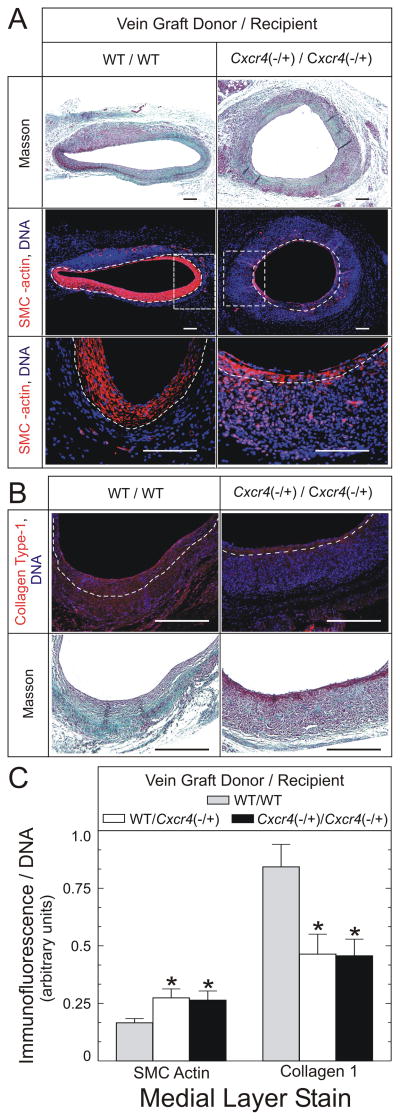
CXCR4 activity affects vein graft composition. Vein grafts of the indicated donor/recipient groups were harvested 6 weeks postoperatively and stained with a modified connective tissue stain (“Masson”), from which neointimal/medial boundaries were identified. Serial sections were fluorescently stained simultaneously for α-SMC actin (A, middle and lower panels, red) and DNA (blue), or for collagen type I (B, upper panel, red) and DNA (blue). Dotted white lines indicate the neointimal/medial boundaries. A, SMC-actin-stained sections. In the middle panels, the dotted rectangles delimit the areas further enlarged for depiction in the lower panels. Scale bars = 100 μm (original magnification ×110, middle panels; ×440, lower panels). B, Collagen I-stained sections; scale bar = 100 μm (original magnification ×440). C, SMC actin and collagen type I fluorescence in the medial layer of each vein graft were normalized to cognate DNA fluorescence intensity within each microscopic field. The resulting ratios were normalized, within each staining group, to those of WT/WT samples to yield “% of control.” Data are plotted as the means ± S.E. of ≥ 4 independent vein graft specimens from each group. Compared with WT/WT control vein grafts: *, P < .05.

