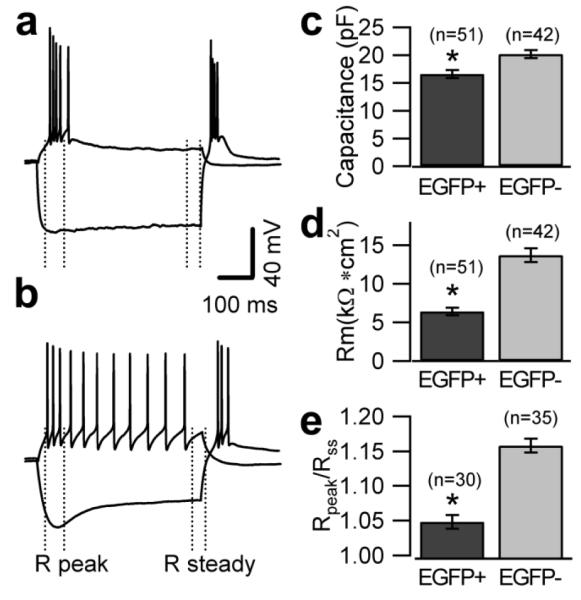
Figure 4. Distinctive Intrinsic properties of EGFP-positive and EGFP-negative UBCs.

a, b, Voltage recordings from one EGFP-positive (a) and one EGFP-negative (b) UBC in response to 500 ms-long injections of hyperpolarizing (−220 pA for EGFP-positive UBC and −80 pA for EGFP-negative UBC) and depolarizing current (40 pA for EGFP-positive UBC and EGFP-negative UBC). The injected hyperpolarizing current was tuned to produce equal peak voltage responses (−130 mV) in the two cells. The dotted lines indicate the trace segments used for the determination of peak and steady state input resistance. c, Bar chart comparing the value of the capacitance in two cell types. Capacitance values were 16.6±0.7 pF in EGFP-positive and 20.2±0.7 pF in EGFP-negative UBCs (n= 51 and 42, respectively, p<0.05). d, Bar chart comparing the value of the specific membrane resistance in two cell types. Specific resistance was determined assuming specific membrane capacitance of 1 μF/cm2. EGFP-positive UBCs have lower specific resistance than EGFP-negative UBCs (6.4±0.5 kΩ*cm2 and 13.7±0.9 kΩ*cm2, n=51 and 42, respectively, p<0.05). e, Bar chart showing the ratio of the peak to steady state input resistance in the two cell types. The ratio was 1.16±0.01 in EGFP-negative UBCs and 1.05±0.01 in EGFP-positive UBCs (n=35 and 30, respectively, p<0.05).
