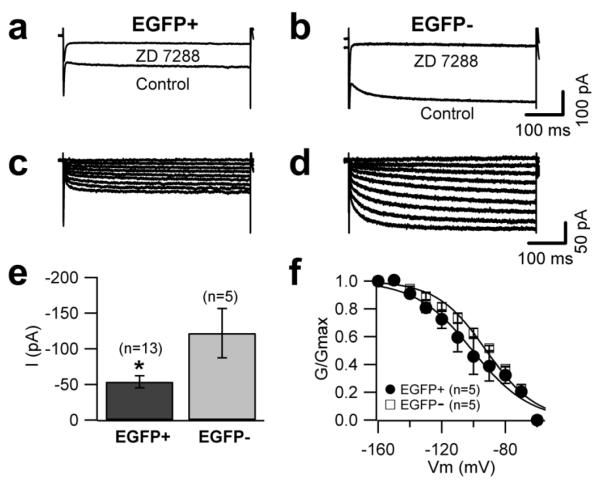
Figure 5. Differential Ih expression in EGFP-positive and EGFP-negative UBCs.
Representative traces of currents recorded in EGFP-positive (a) and EGFP-negative (b) UBCs in response to 500 ms-long voltage steps in control conditions and after bath application of 100 μM Zd7288 (at −140 mV). c, d, Traces of the ZD7288-sensitive current obtained by digital subtraction. Cells were held at −60 mV and clamped at potentials between −60 and −160 mV in 10 mV steps. The bar chart in (e) represents the size of ZD7288 sensitive currents (at −140 mV) in EGFP-positive and EGFP-negative UBCs; Ih was larger in EGFP-negative UBCs. f, Conductance-voltage relationship of the ZD7288 sensitive current. The data points were fit with a Boltzmann equation. Half points and slopes of the fits were not statistically different between the two populations.

