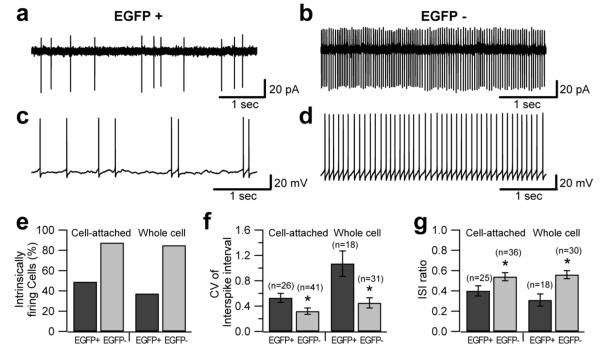
Figure 6. Intrinsic firing patterns differ in EGFP-positive and EGFP-negative UBCs.
a-d, Voltage clamp cell-attached recordings (a, b) and whole-cell current clamp recordings (c, d, no current injection) of intrinsic firing in UBCs. EGFP-positive cells (a, c) exhibited spontaneous bursting, while EGFP-negative cells (b, d) fired more regularly. e, Bar chart summarizing the fraction of intrinsically firing cells in the two populations: 88% and 85% of EGFP-negative UBCs were intrinsically firing in cell-attached (48 total recordings) and whole-cell recording (40 total recordings), respectively. For EGFP-positive UBCs, the fraction of intrinsically firing cells was 49% in cell-attached and 37% in whole-cell (55 and 51 recordings, respectively). f, Coefficient of variation of the interspike interval in the two cell types. In the cell-attached the values were 0.53 for EGFP-positive UBCs and 0.32 for EGFP-negative UBCs. In whole-cell the values were 1.07 for EGFP-positive UBCs and 0.45 in EGFP-negative UBCs (p<0.05). g, Interspike interval ratio (obtained by dividing the shortest interspike interval in the recording by the average interspike interval) measured in cell-attached and whole-cell in the two UBC subpopulations.

