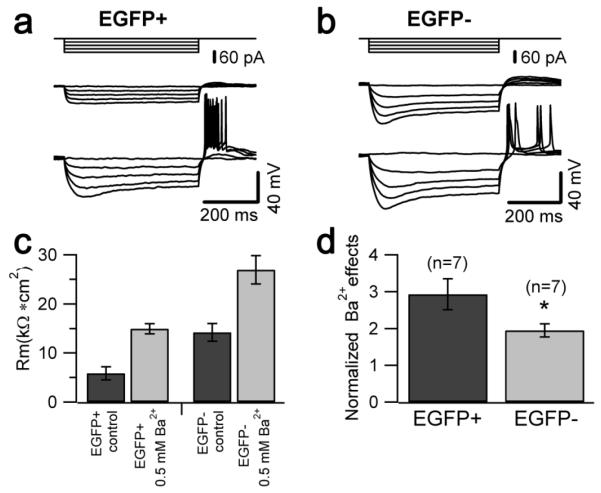
Figure 7. Differential effects of Ba2+ on EGFP-positive and EGFP-negative UBCs.
a, b, Voltage traces recorded in an EGFP-positive (a) and an EGFP-negative UBC (b) in response to 500 ms-long hyperpolarizing current injections (from 0 to −80 pA, 20 pA steps, upper traces) in control conditions (middle traces) and after bath application of Ba2+ (lower traces). c, Bar chart summarizing the effect of 0.5 mM Ba2+ on membrane resistance in EGFP-positive and EGFP-negative UBCs (n=7). Specific membrane resistance in EGFP-positive UBCs was 5.86±1.33 kΩ*cm2 in control condition (n=7) and increased following Ba2+ application (14.95±1.05 kΩ*cm2), whereas resistance was increased from 14.21±1.82 kΩ*cm2 (control condition, n=7) to 26.97±2.89 kΩ*cm2 (Ba2+ application) in EGFP-negative UBCs. d, Bar chart of the fractional effect of Ba2+ on the specific membrane resistance in each cell type. The fractional effect of Ba2+ was significantly larger in EGFP-positive than in EGFP-negative UBCs.

