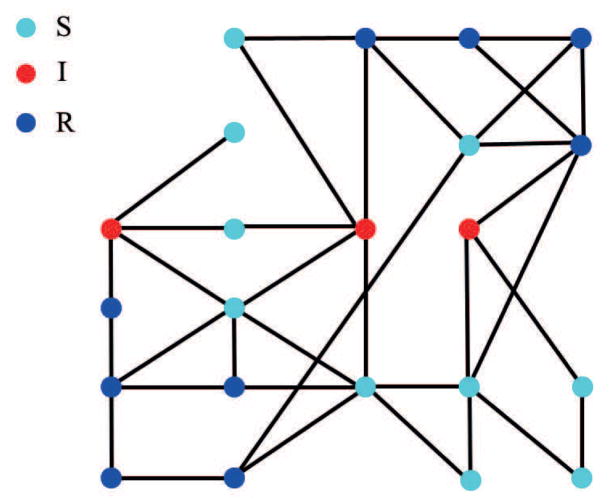
Figure 2.
The state of a social network on the third day of an epidemic which started at the lower left and upper right corners. Susceptibles are shown in cyan, infectives in red and recovereds in blue. Every infective is three edges from one of the two original infectives along some route of transmission. Each infective shares an edge with at least one recovered, namely the recovered that infected it. One susceptible will never become infected. The epidemic can continue for at most six more steps. We have omitted the probabilities on the edges.

