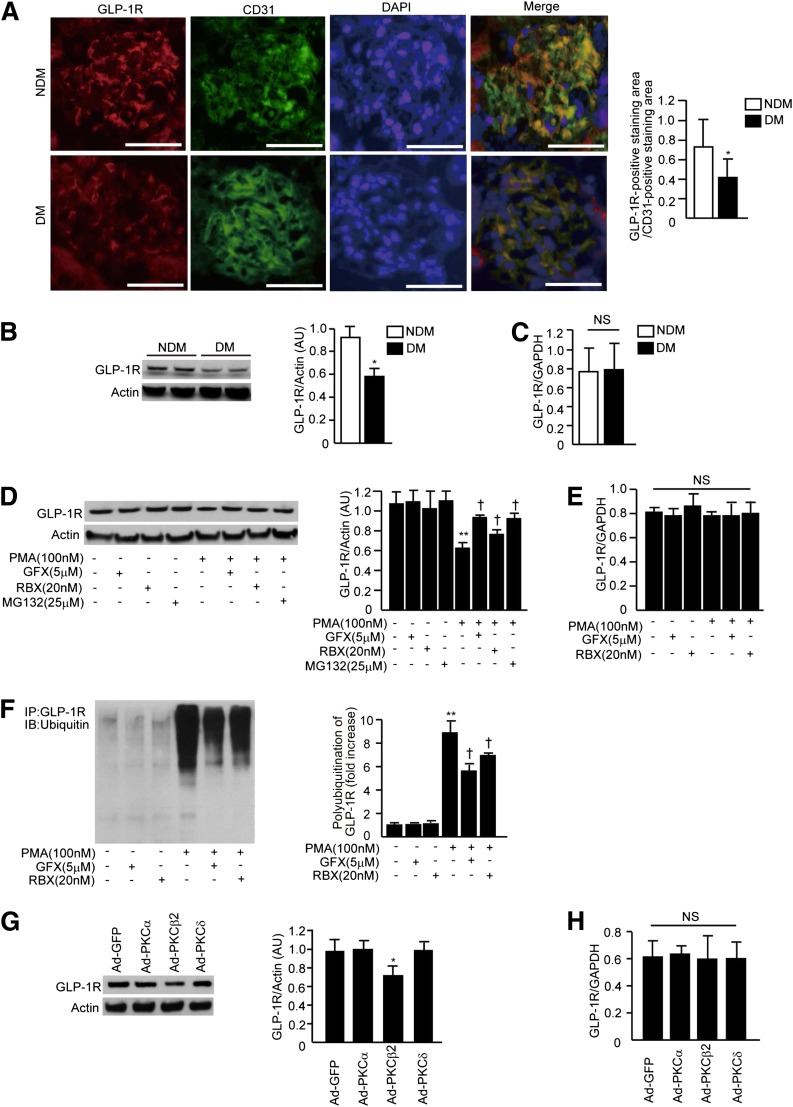
FIG. 1.
Diabetes and PKCβ2 activation decreases GLP-1R. A: Immunostaining for GLP-1R and CD31 and merge images in the glomeruli and morphometric analysis of glomerular expression of GLP-1R and CD31. For quantification of the expression of GLP-1R and CD31, the positive staining area/glomerular area (%) was measured using ImageJ (NIH). For each animal, 50 glomeruli were evaluated. Bar = 50 μm. n = 6 in nondiabetic WT and diabetic WT mice; n = 7 in nondiabetic transgenic and diabetic transgenic mice. n = number of mice. DM, mice with STZ-induced diabetes; NDM, nondiabetic mice. *P < 0.05. Magnification ×400. B: Immunoblots of GLP-1R from renal cortex of mice with STZ-induced diabetes for 6 months. n = 6 in nondiabetic WT and diabetic WT mice; n = 7 in nondiabetic transgenic and diabetic transgenic mice. *P < 0.05. C: GLP-1R mRNA expression in the renal cortex of mice with STZ-induced diabetes for 6 months. n = 6 in nondiabetic WT and diabetic WT mice; n = 7 in nondiabetic transgenic and diabetic transgenic mice. D: Immunoblots of GLP-1R in RGECs. RGECs were incubated with PMA (4 h) with or without a PKC-specific inhibitor (GFX), PKCβ-specific inhibitor (RBX), or proteasome inhibitor (MG132). **P < 0.001 vs. PMA−, GFX−, RBX−, and MG132−. †P < 0.05 vs. PMA+, GFX−, RBX−, and MG132−. E: GLP-1R mRNA expression in the renal cortex of mice with STZ-induced diabetes for 6 months. F: Immunoprecipitation and immunoblots of ubiquitin-targeted GLP-1R. RGECs were incubated with PMA (4 h) with or without GFX or RBX. Whole-cell lysates were immunoprecipitated with anti–GLP-1R antibody, subjected to SDS-PAGE, and blotted with ubiquitin antibody. **P < 0.001 vs. PMA−, GFX−, and RBX−. †P < 0.05 vs. PMA+, GFX−, and RBX−. G and H: Immunoblot analyses (G) and mRNA expression (H) of GLP-1R. RGECs were transfected with Ad–green fluorescent protein (GFP), Ad-PKCα, Ad-PKCβ2, or Ad-PKCδ as indicated. *P < 0.05 vs. Ad–green fluorescent protein. One of three independently performed experiments is shown. Comparisons were made between groups using either two-sample and paired t tests for two-way comparisons or one-way ANOVA for multiple groups to establish statistically significant differences. Results are means ± SD. AU, arbitrary units; GAPDH, glyceraldehyde-3-phosphate dehydrogenase; IB, immunoblot; IP, immunoprecipitation; NS, not significant. (A high-quality digital representation of this figure is available in the online issue.)

