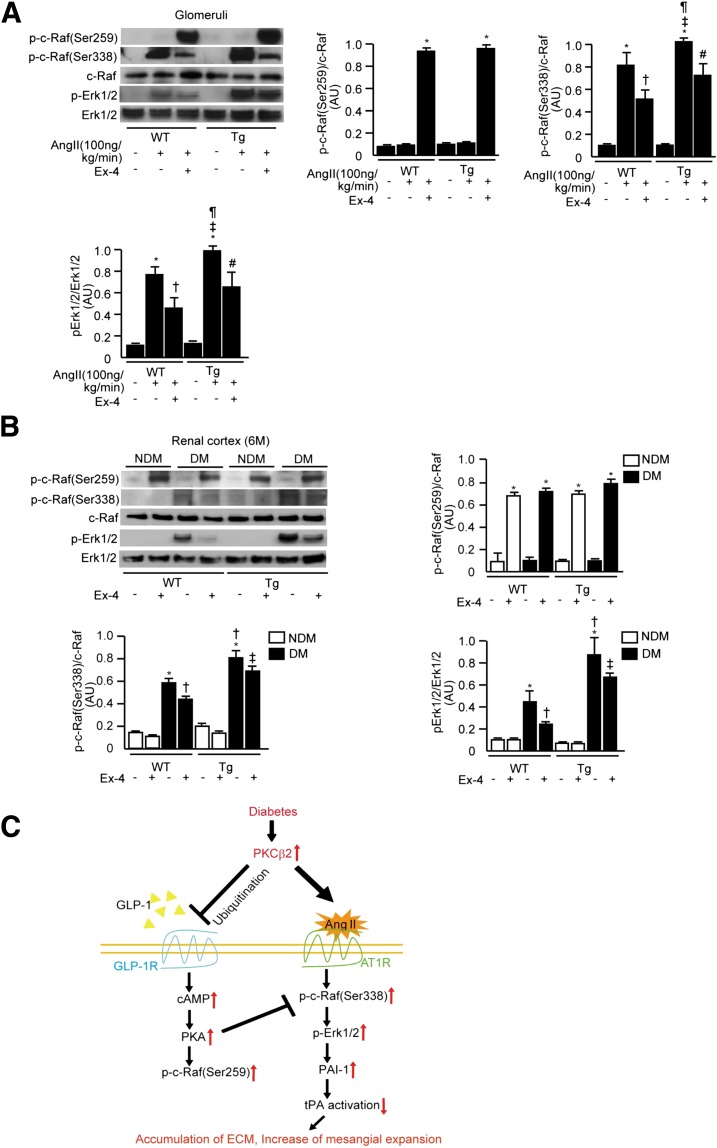
FIG. 7.
Exendin-4 (Ex-4) decreased angiotensin II or diabetes-induced increases of phospho–c-Raf (p-c-Raf)(Ser338) in the glomeruli and renal cortex. A: Immunoblots of phospho–c-Raf(Ser259), phospho–c-Raf(Ser338), and phospho-Erk1/2 (p-Erk1/2) in the glomeruli. Exendin-4 (1.0 nmol/kg) or diluents were administrated intraperitoneally to mice. After 2-h administration of exendin-4, Ang II (100 ng/kg/3 mL/min) or saline was infused through the jugular vein. After 3-h continuous infusion, glomeruli were corrected. n = 3–5. Tg, transgenic. *P < 0.05 vs. WT/Ang II−/exendin-4−; †P < 0.05 vs. WT/Ang II+/exendin-4−; ‡P < 0.05 vs. transgenic/Ang II−/exendin-4−; ¶P < 0.05 vs. WT/Ang II+/exendin-4−; #P < 0.05 vs. transgenic/Ang II+/exendin-4−. B: Immunoblots of phospho–c-Raf(Ser259), phospho–c-Raf(Ser338), and phospho-Erk1/2 in the renal cortex. n = 6 in nondiabetic WT plus vehicle, nondiabetic WT plus exendin-4, diabetic WT plus vehicle, diabetic WT plus exendin-4, nondiabetic transgenic plus exendin-4, and diabetic transgenic plus exendin-4; n = 7 in nondiabetic transgenic plus vehicle and diabetic transgenic plus vehicle. DM, mice with STZ-induced diabetes; NDM, nondiabetic mice. *P < 0.05 vs. WT/nondiabetic/exendin-4−; †P < 0.05 vs. WT/diabetic/exendin-4−; ‡P < 0.05 vs. transgenic/diabetic/exendin-4−. One of three independently performed experiments is shown. Comparisons were made between groups using either two-sample and paired t tests for two-way comparisons or one-way ANOVA for multiple groups to establish statistically significant differences. Results are expressed as means ± SD. C: Schematic diagram of the inhibitory effects of PKCβ2 on the protective action of GLP-1 signaling against the effects of Ang II–mediated glomerular pathology. AU, arbitrary units; ECM, extracellular matrix.

