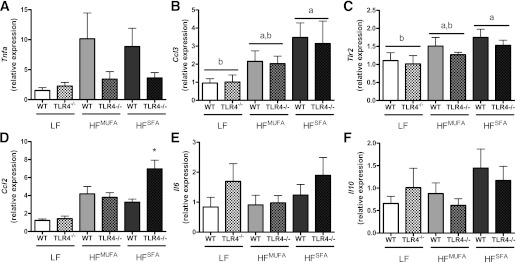
FIG. 2.
AT inflammation. Real time RT-PCR was used to assess AT mRNA expression of Tnfa (P = 0.07 for genotype effect; P < 0.10 for diet effect) (A), Ccl3 (B), Tlr2 (C), Ccl2 (D), Il6 (E), and Il10 (F). Data are presented as mean ± SEM (n = 5–16). *P < 0.05 for HFSFA compared with LF in (B) and (C), *P < 0.05 for HFSFA TLR4−/− compared with HFSFA WT in (D), and P < 0.05 for groups not connected by the same letter.

