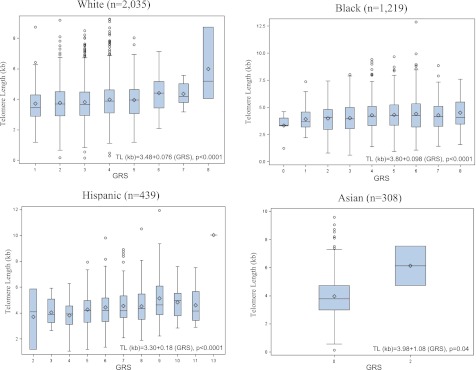
FIG. 2.
TL by GRS according to race/ethnicity. The boxplots show the mean (◇), median, and interquartile range. The vertical line indicates the minimum and maximum value >1.5 times the upper quartile of TL in each group. Outliers (○) are displayed when the individual TL is >1.5 times the interquartile range of the upper quartile value. GRS represents the unweighted sum of alleles from the selected SNPs. The selected SNPs for each of the ethnic groups are as follows: 1) whites, rs34368910, rs4888444, rs4975605, rs938886, and rs12880583; 2) blacks, rs872072, rs938886, rs1713458, and rs4387287; 3) Hispanics, rs35276863, rs729421, rs11972248, rs4635969, rs2853669, rs2736098, and rs2853676; and 4) Asians, rs11556640 and rs2297613. (A high-quality color representation of this figure is available in the online issue.)

