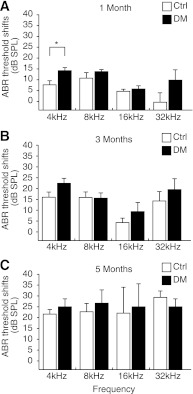
FIG. 2.
Chronologic changes in the ABR threshold shift were not significantly different between the diabetic group and controls throughout the observation period except at 4 kHz at 1 month. The time course of ABR threshold shifts compared with baseline (A–C) at each observation period (1, 3, and 5 months) for the diabetic (DM) group (n = 5 for each period) and control (Ctrl) group (n = 5 for each period). Data are means ± SE. *P < 0.05 diabetic vs. control group.

