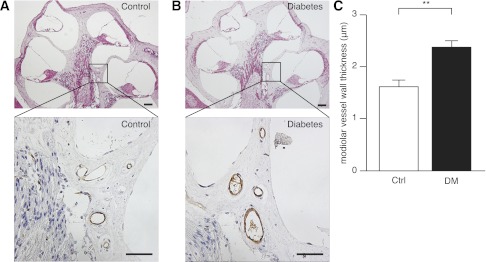
FIG. 3.
H-E staining (top panel; scale bar = 100 μm) and CD31 immunostaining (bottom panel; scale bar = 20 μm) of the vessel endothelial cells at the modiolus in control (Ctrl) cochlea (A) and diabetic (DM) cochlea (B). The vessel wall thickness of staining for CD31, quantified by a computer-aided image-analysis system, is shown for both diabetic (n = 5) and control (n = 5) mice at 5 months of diabetes as described in research design and methods (C). Data are means ± SE. **P < 0.01 diabetic vs. control group. (A high-quality digital representation of this figure is available in the online issue.)

