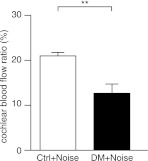
FIG. 5.
The cochlear blood flow ratio measured by laser-Doppler flowmeter is shown for both diabetic (DM) (n = 4) and control (Ctrl) (n = 4) mice 14 days after noise exposure (4-kHz OBN, 105-dB SPL for 2 h) as described in research design and methods. Data are means ± SE. **P < 0.01 diabetic vs. control group.

