FIG. 3.
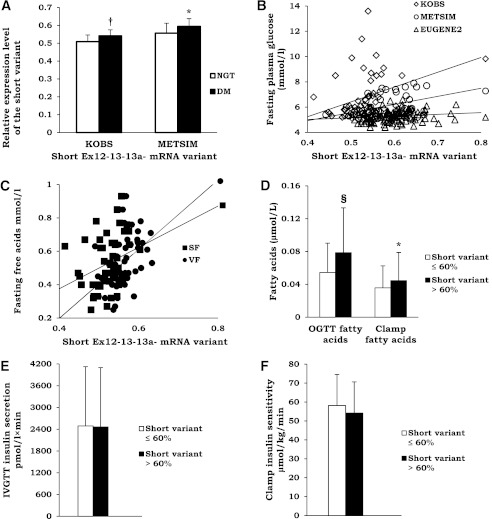
A: Prevalence of the short TCF7L2 variant (see Fig. 1) in subcutaneous fat in individuals with and without type 2 diabetes in the KOBS and METSIM studies. White bars, normal glucose tolerance (NGT) subjects; black bars, type 2 diabetes (DM) subjects. Mean ± SD shown. *P < 0.05; †P < 0.01. B: Scatter plot demonstrating correlation between the short mRNA TCF7L2 variant expression (see Fig. 1) and fasting plasma glucose in the KOBS, EUGENE2, and METSIM studies in subcutaneous fat. White diamonds, KOBS study; white circles, METSIM study; white triangles, EUGENE2 study (KOBS, r = 0.335, P = 0.016; METSIM, r = 0.382, P = 0.011; EUGENE2, r = 0.218, P = 0.026). C: Scatter plot demonstrating correlation between the expression of the short TCF7L2 variant in subcutaneous fat (SF; black squares) (r = 0.350; P = 0.014) and visceral fat (VF; black circles) (r = 0.581; P = 1.8 × 10⁻⁵) and fasting plasma glucose and serum FFAs in the KOBS study. D: Insulin action in adipose tissue measured as serum FFA levels at 120 min after an oral glucose load (OGTT) (n = 216, all studies combined) or as serum FFA levels at the end of 40 mU euglycemic clamp (n = 113, EUGENE2 study) in individuals with low (white bars) or high (black bars) prevalence of the TCF7L2 short mRNA variant (divided by the median value). Mean ± SD shown. *P < 0.05; §P < 1 × 10⁻⁴. Insulin secretion measured during IVGTT (E) and insulin sensitivity measured as whole-body glucose uptake during the hyperinsulinemic euglycemic clamp (F) in the EUGENE2 study in individuals with low (white bars) or high (black bars) prevalence of the TCF7L2 short mRNA variant (divided by the median value).

