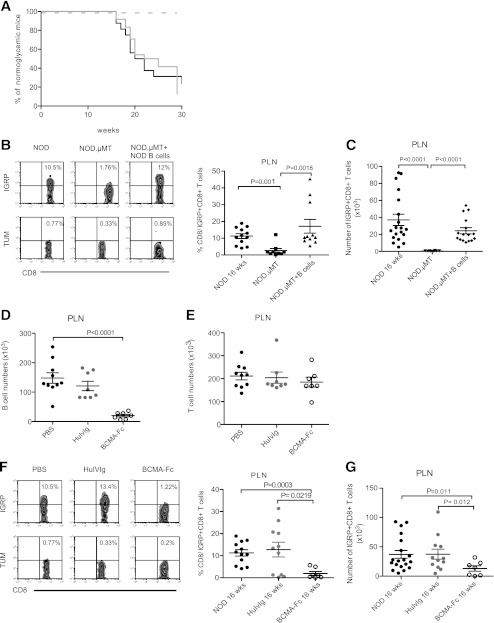
FIG. 1.
Expansion of self-reactive CD8+ T cells in B cell–deficient NOD mice. A: T1D incidence in female NOD (n = 15; black solid line), NOD.µMT (n = 15; dashed line), or B cell–reconstituted NOD.µMT mice (NOD.µMT + NOD B cells; n = 24; gray solid line). P < 0.01 for NOD.µMT + NOD B cell vs. NOD.µMT mice; P < 0.01 for NOD mice vs. NOD.µMT mice. B: Representative dot plots and cumulative data showing frequency of IGRP-specific CD8+ T cells in PLN of 16-week-old female NOD, NOD.µMT, and NOD.µMT + B cell mice. Background indicated by TUM-tetramer staining. Data represent mean ± SEM; each point represents one mouse; n ≥ 10 mice/group. C: Absolute numbers of IGRP-specific CD8+ T cells in PLN calculated from B. Data represent mean ± SEM; each point represents one mouse; n ≥ 10 mice/group. D: Absolute numbers of B cells in the PLN of 16-week-old NOD mice treated with PBS (black circles) or 150 μg i.p. of either HuIvIg (gray circles) or BCMA-Fc (open circles) twice weekly from 9–15 weeks of age. Data represent mean ± SEM; each point represents one mouse; n ≥ 7 mice/group. E: Absolute numbers of T cells in the PLN from 16-week-old NOD mice treated as in D with PBS (black circles), HuIvIg (gray circles), and BCMA-Fc (open circles). Data represent mean ± SEM; each point represents one mouse; n ≥ 6 mice/group. F: Representative dot plots and cumulative data showing frequency of IGRP-tetramer+CD8+ T cells in the PLN of 16-week-old NOD mice treated as in D with PBS (black circles), HuIvIg (gray circles), and BCMA-Fc (open circles). Data represent mean ± SEM; each point represents one mouse; n ≥ 7 mice/group. G: Absolute numbers of IGRP-specific CD8+ T cells in PLN calculated from F. Data represent mean ± SEM; each point represents one mouse; n ≥ 7 mice/group.

