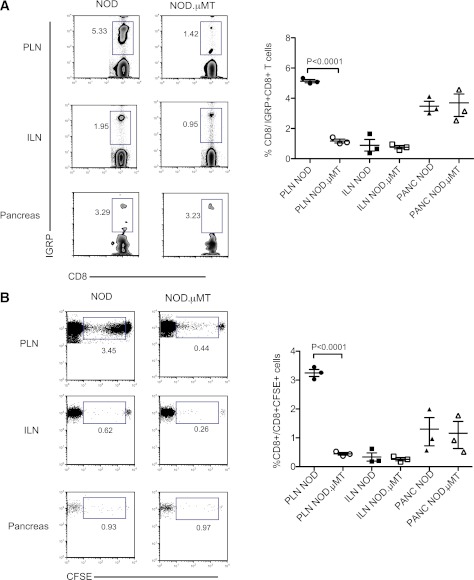
FIG. 2.
B cells drive the proliferative expansion of self-reactive CD8+ T cells in the PLN. For each datum, representative dot plots and cumulative data captured from indicated rectangular gate are shown. A: Expansion of IGRP-tetramer+ NOD8.3 CD8+ T cells in the pancreas and the PLN and inguinal LN (ILN) 3 days post–adoptive transfer into NOD or NOD.µMT recipients. Data represent mean ± SEM; each point represents one mouse; n ≥ 3 mice/group. B: Proliferation of CFSE-labeled NOD8.3 CD8+ T cells in the pancreas (PANC), PLN, and ILN 4 days post–adoptive transfer into NOD or NOD.µMT recipients. Numbers in the box are a representation of the mean. Data represent mean ± SEM; each point represents one mouse; n ≥ 3 mice/group from three experiments, each with identical results. (A high-quality color representation of this figure is available in the online issue.)

