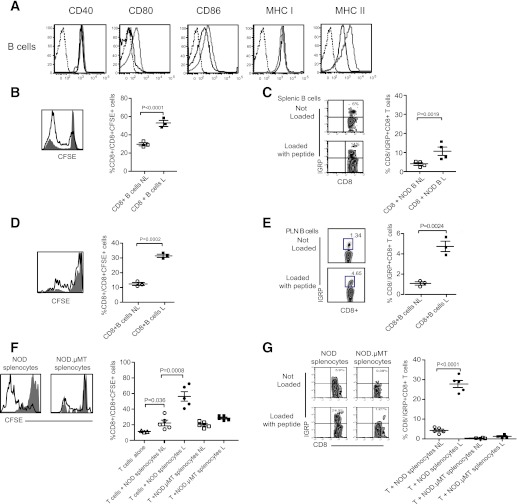
FIG. 3.
B cells present autoantigen to CD8+ T cells. A: Representative flow cytometric analysis of CD40, CD80, CD86, MHC class I, and MHC class II expression on IgM+B220+ B cells in the PLN of 4-week-old NOD mice (black line; n ≥ 6 mice/group) and 16-week-old NOD mice (gray line; n ≥ 6 mice/group). Isotype controls, dotted line. B: Representative histogram and cumulative data showing proliferation of CFSE-labeled NOD CD8+ T cells cultured with purified NOD splenic B cells loaded, or not loaded, with IGRP206–214 peptide. For representative histogram, not loaded is closed histogram, and loaded is open histogram. For cumulative data, not loaded (NL) is open symbol, loaded (L) is closed symbol, and horizontal bar indicates mean ± SEM. n = 3 mice/group from three independent experiments. C: Representative dot plot and cumulative data showing expansion of IGRP-specific NOD CD8+ T cells cultured with purified NOD splenic B cells loaded, or not loaded, with IGRP206–214 peptide. For representative dot plots: not loaded (Not Loaded) and loaded (Loaded with peptide). For cumulative data, not loaded (NL) is open symbol, loaded (L) is closed symbol, and bar indicates mean ± SEM. n = 4 mice/group from three independent experiments. D: Representative histogram and cumulative data showing proliferation of CFSE-labeled NOD CD8+ T cells cultured with purified PLN B cells loaded, or not loaded, with IGRP206–214 peptide. For representative histogram, not loaded is closed histogram, and loaded is open histogram. For cumulative data, not loaded (NL) is open symbol, loaded (L) is closed symbol, and bar indicates mean ± SEM. n = 3 mice/group from three independent experiments. E: Representative dot plot and cumulative data showing expansion of IGRP-specific NOD CD8+ T cells cultured with purified NOD PLN B cells loaded, or not loaded, with IGRP206–214 peptide. For representative dot plots: not loaded (Not Loaded) and loaded (Loaded with peptide). For cumulative data, not loaded (NL) is open symbol, loaded (L) is closed symbol, and bar indicates mean ± SEM. n = 4 mice/group from three independent experiments. F: Representative histogram and cumulative data showing proliferation of CFSE-labeled NOD CD8+ T cells cultured with NOD splenocytes or NOD.µMT splenocytes loaded, or not loaded, with IGRP206–214 peptide. For representative histogram, not loaded is closed histogram, and loaded is open histogram. For cumulative data, not loaded (NL) is open symbol, loaded (L) is closed symbol, and bar indicates mean ± SEM. n ≥ 3 mice/group from three independent experiments. G: Representative dot plot and cumulative data showing expansion of IGRP-specific NOD CD8+ T cells cultured with NOD splenocytes or NOD.µMT splenocytes loaded, or not loaded, with IGRP206–214 peptide. For representative dot plots: not loaded (Not Loaded) and loaded (Loaded with peptide). For cumulative data, not loaded (NL) is open symbol, loaded (L) is closed symbol, and bar indicates mean ± SEM. n = 4 mice/group from three independent experiments. (A high-quality color representation of this figure is available in the online issue.)

