FIG. 5.
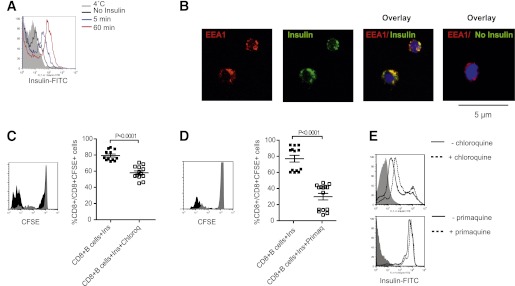
Features of insulin cross-presentation by B cells. A: Purified B cells were pulsed with FITC-labeled insulin, and the kinetics of insulin uptake was assessed by flow cytometric analysis of green fluorescence. Data representative of one of three independent experiments conducted. B: Confocal immunofluorescence images of NOD splenic B cells showing localization of insulin-FITC (green) with EAA1-positive (red) endosomes; nuclei are counterstained with DAPI (blue). Original magnification ×600. C: Representative histogram and cumulative data showing proliferation of CFSE-labeled NOD CD8+ T cells cultured with purified NOD splenic B cells loaded with intact insulin with or without chloroquine. For representative histogram, insulin is black histogram, and insulin plus chloroquine is gray histogram. For cumulative data, insulin (Ins) is closed symbol, insulin plus chloroquine (Ins+Chloroq) is open symbol, and bar indicates mean ± SEM. n ≥ 6 mice/group from three independent experiments. D: Representative histogram and cumulative data showing proliferation of CFSE-labeled NOD CD8+ T cells cultured with purified NOD splenic B cells loaded with intact insulin with or without primaquine. For representative histogram, insulin is black histogram, and insulin plus primaquine is gray histogram. For cumulative data, insulin (Ins) is closed symbol, insulin plus primaquine (Ins+Primaq) is open symbol, and bar indicates mean ± SEM. n ≥ 6 mice/group from three independent experiments. E: Representative flow cytometric analysis showing uptake of FITC-labeled insulin by purified NOD B cells after 1-h pulse in the presence (dotted line) or absence (black line) of chloroquine or primaquine; NOD B cells not pulsed with insulin are indicated by gray-shaded histogram. (A high-quality digital representation of this figure is available in the online issue.)

