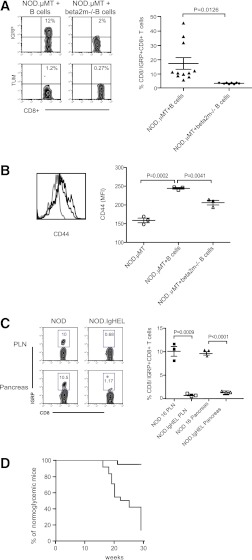
FIG. 7.
B-cell antigen capture, cross-presentation, and diabetes development. A: Frequency of IGRP-specific CD8+ T cells in female NOD.µMT mixed bone marrow–B-cell chimeras reconstituted with either wild-type NOD B cells (NOD.µMT + B cells) or NOD.β2m−/− B cells (NOD.µMT + beta2m−/− B cells). Representative FACS plot and cumulative data are shown. TUM represents control tetramer. Each symbol represents one mouse; n ≥ 6/group; bar indicates mean ± SEM. B: Expression of CD44 on CD8+ T cells from the PLN of NOD.µMT mice (light gray line) and NOD.µMT mixed bone marrow–B-cell chimeras reconstituted with either NOD B cells (black line) or NOD.β2m−/− B cells (dark gray line). n ≥ 3 mice/group. C: Representative plot and cumulative data showing frequency of IGRP-specific NOD CD8+ T cells in PLN and pancreas of 16-week-old NOD or NOD.IgHEL mice. Data represent mean ± SEM; each point represents one mouse; n = 3 mice/group. Data are representative of four independent experiments. D: Kaplan-Meier analysis of diabetes incidence in female NOD.µMT mixed bone marrow–B-cell chimeras reconstituted with wild-type NOD B cells (NOD.µMT+B cells; n = 24/group, gray line) or NOD.β2m−/− B cells (NOD.µMT+.β2m−/− B cells; n = 20/group, black line). P < 0.0001 (log-rank) for NOD B cell vs. NOD.β2m−/− B cell–reconstituted NOD.µMT mice. Data are pooled from three independent experiments. (A high-quality color representation of this figure is available in the online issue.)

