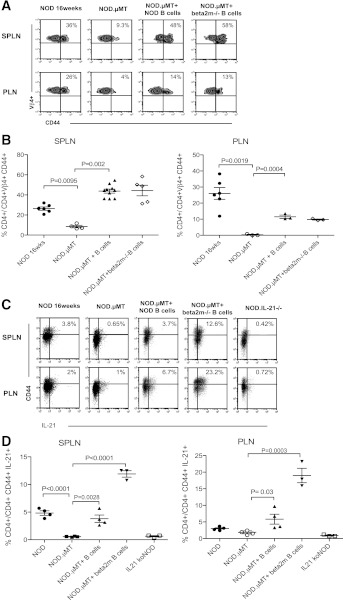
FIG. 8.
B cells and activation of self-reactive CD4+ T cells. A: Representative dot plots showing frequency of Vβ4+CD44hiCD4+ T cells in spleen (SPLN) and PLN of 16-week old NOD mice (n = 6), NOD.µMT mice (n ≥ 3), and NOD.µMT mixed bone marrow–B-cell chimeras reconstituted with NOD B cells (n = 6) or with NOD.β2m−/− B cells (n = 3). Percentage given indicates median value. B: Cumulative data, mean ± SEM, calculated from A. C: Representative dot plots showing frequency of IL-21+CD44hiCD4+ T cells in the spleen (SPLN) and PLN of 16-week-old NOD mice (n = 6), NOD.µMT mice (n = 3), and NOD.µMT mixed bone marrow–B-cell chimeras reconstituted with NOD B cells (n = 6) or with NOD.β2m−/− B cells (n = 3). Percentage given indicates median value. IL-21−/− mice were used to control for specificity. D: Cumulative data, mean ± SEM, calculated from C.

