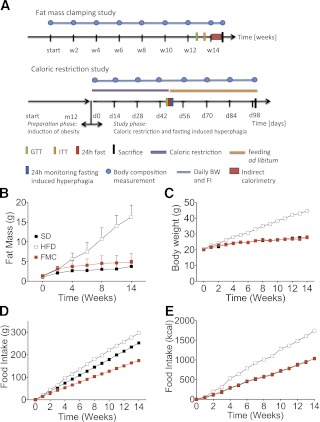
FIG. 1.
A: Study design and FM clamping. B: FM was measured by nuclear magnetic resonance technology and did not differ between SD and FMC mice. C: BW of SD, HFD fed, and FMC mice was measured daily. Mice from the SD and HFD group were fed with SD or HFD ad libitum. Mice from the FMC group were fed defined amounts of HFD to match FM to the SD group. D: Absolute food intake was lowest in FMC mice (P < 0.001). E: Caloric intake was similar in FMC and SD mice and highest in mice of the HFD group. All mice are male (n = 16 per group). All data are represented as mean ± SEM. ITT, insulin tolerance test; FI, food intake.

