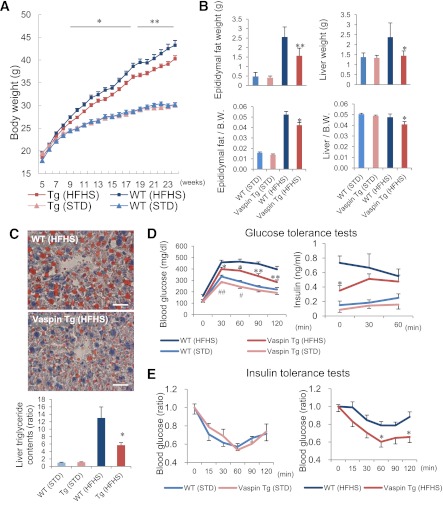
FIG. 1.
Phenotype of WT and vaspin Tg mice. A: Body weight of WT and vaspin Tg mice fed standard (STD) and HFHS chow (n = 20). B: Epididymal fat and liver weight of WT and vaspin Tg mice at 25 weeks of age (n = 5–9). B.W., body weight. C: Oil Red O staining of liver and triglyceride contents of WT and vaspin Tg mice at 25 weeks of age. Triglyceride contents were normalized by liver weight, and fold changes compared with WT normal chow mice are indicated. Bar = 300 μm (n = 5–9). D: Glucose tolerance test at 12 weeks of age (1.5 mg/kg body wt i.p.) (n = 5–9). E: Insulin tolerance test at 12 weeks of age (0.75 units/kg body wt i.p. for standard chow and 1.0 units/kg body wt i.p. for HFHS) (n = 4–10). All values are presented as means ± SEM. *P < 0.05, **P < 0.01 vs. WT HFHS mice; #P < 0.05, ##P < 0.01 vs. WT HFHS mice. (A high-quality digital representation of this figure is available in the online issue.)

