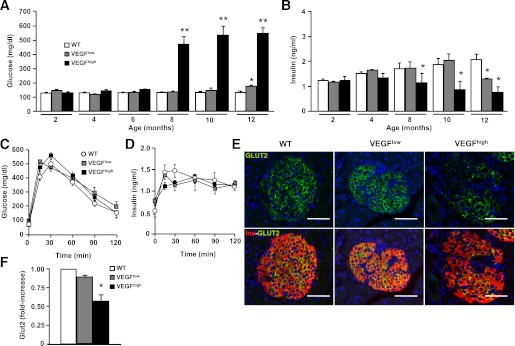
FIG. 4.
Glucose homeostasis in VEGFlow and VEGFhigh mice. Blood glucose (A) and insulin (B) levels were monitored in fed mice from 2–12 months: wild-type (WT) mice (white bar), transgenic VEGFlow mice (gray bar), and transgenic VEGFhigh mice (black bar) (n = 15 animals/group). **P < 0.01 *P < 0.05 transgenic vs. WT. Glucose tolerance (C) and in vivo insulin secretion (D) were determined after an intraperitoneal glucose injection (2 g/kg body weight) into 2-month-old mice WT (white circle), VEGFlow mice (gray square), and VEGFhigh mice (black square) (n = 10 animals/group). E: Immunohistochemical analysis of GLUT-2 (green) and insulin (red) in islets from 2-month-old mice is shown. F: GLUT-2 mRNA expression from isolated islets from 2-month-old VEGFlow and VEGFhigh mice was determined by qPCR (n = 3 pools of islets from three mice per pool): WT mice (white bar), transgenic VEGFlow mice (gray bar), and transgenic VEGFhigh mice (black bar). Scale bars, 100 µm. *P < 0.05 vs. WT mice. (A high-quality digital representation of this figure is available in the online issue.)

