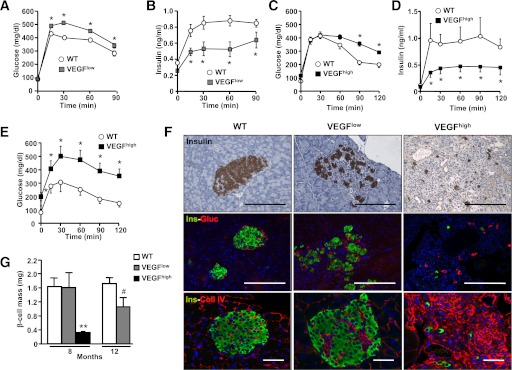
FIG. 5.
Glucose homeostasis in VEGFlow and VEGFhigh mice was impaired with age. Glucose tolerance (A) and insulin in vivo secretion (B) were measured in 12-month-old wild-type (WT) (white circle) and VEGFlow mice (gray square) (n = 12 animals/group). *P < 0.05 VEGFlow vs. WT mice. Glucose tolerance (C) was determined in parallel to in vivo insulin secretion (D) after a glucose load (2 g/kg body weight [b.w.]) in 5-month-old WT mice (white circle) and transgenic VEGFhigh mice (black square). At this age, VEGFhigh mice were normoglycemic, but showed impaired insulin release and glucose intolerance after the glucose load (n = 12 animals/group). *P < 0.05 VEGFhigh vs. WT mice. E: Eight-month-old VEGFhigh mice (black square) were glucose-intolerant compared with age-matched WT (white square) mice as shown by a glucose tolerance test (1 g/kg b.w.) (n = 10 animals/group). *P < 0.05 VEGFhigh vs. WT mice. F: Top panel: representative images of insulin immunostaining of islets. Middle panel: immunohistochemical analysis of insulin (green) and glucagon (red) expression. Bottom panel: immunohistochemical analysis of collagen IV (red) and insulin (green). Islets from 12-month-old WT and VEGFlow and 8-month-old VEGFhigh mice are shown. Scale bars, 100 µm. G: β-Cell mass was determined by insulin immunostaining in 8- and 12-month-old VEGFlow and 8-month-old VEGFhigh mice and compared with age-matched WT mice, as indicated in Research Design and Methods (WT mice [white bar], transgenic VEGFlow mice [gray bar], and transgenic VEGFhigh mice [black bar]) (n = 3 sections/mouse and 4 animals/group). **P < 0.001 VEGFhigh vs. WT mice, #P < 0.1 VEGFlow vs. WT. (A high-quality digital representation of this figure is available in the online issue.)

