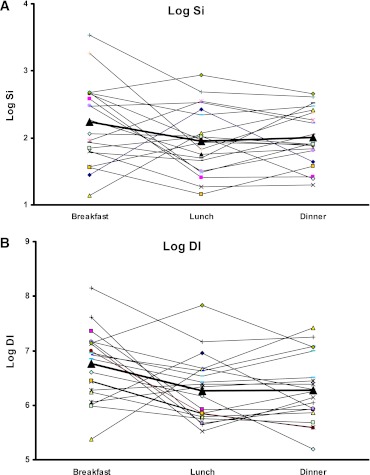
FIG. 5.
A: Model-based Si for all subjects for each meal shown individually with log-transformed data. The boldface line indicates the average estimates for each meal. B: Model-based DI total for all subjects for each meal shown individually with log-transformed data. The boldface line indicates the average estimates for each meal. (A high-quality color representation of this figure is available in the online issue.)

