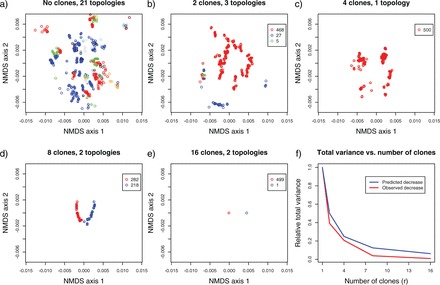
Figure 3.

NMDS representation in Euclidean space of a sample of size 500 trees from the r-th posterior distribution in geodesic space of the tree topologies, as the number of clones increase [(panels a) to e)], for the complete chloroplast data set (86 genes). Each color represents a different topology, and the number of different topologies is specified above each plot. Panel f) depicts the reduction in the relative total variance as the number of clones increases (see text for details).
