
Figure 2.
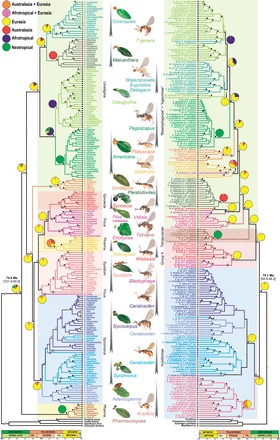
BEAST chronograms of the evolutionary history of figs and fig wasps. Groups of figs and their associated genera of pollinators are represented using the same color. Ficus subgenera and Agaonidae subfamilies according to current classifications are delimited by colored rectangles (Pharma. for Ficus subgenus Pharmacosycea). Pie charts at main nodes show the likelihood of different geographic areas of origin as inferred by Mesquite (see “Materials and Methods” section). Gray rhombuses show clades of fig species from Continental Asia, whereas gray arrows indicate hypothesized southward migration of clades. Squares correspond to node supports: Black square: BP > 70% and PPMrBayes or PPBEAST> 0.95; white square: BP > 70% or PPMrBayes or PPBEAST> 0.95. Details in this figure can be viewed at greater magnification at Systematic Biology online.