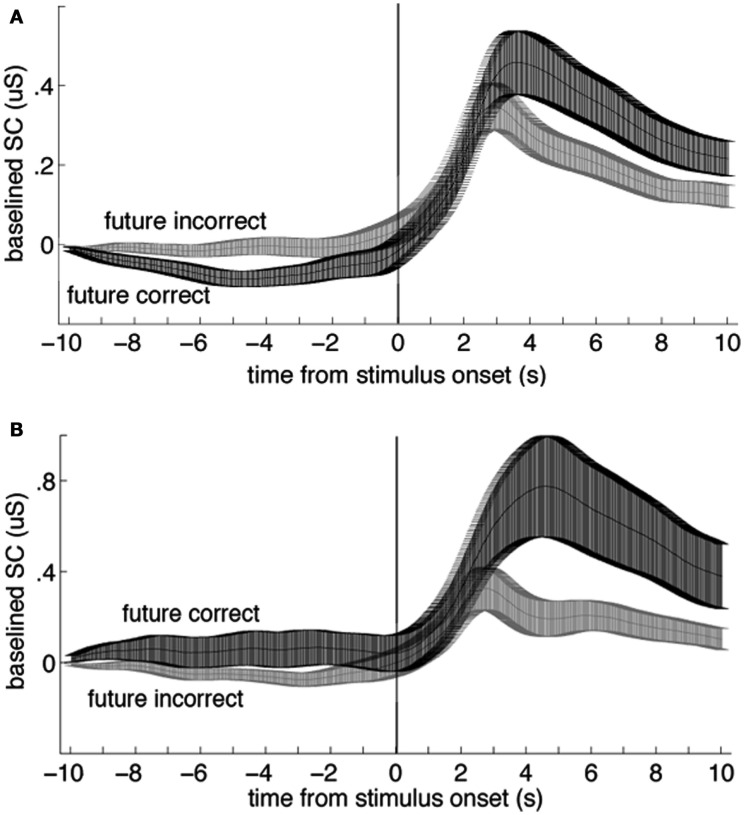
Figure 1.
Examples of data that would be coded with a negative (A) and a positive (B) sign for the effect size. In each plot, the two lines represent group mean skin conductance baselined to the mean value from −11 to −10 s for trials in a four-choice guessing paradigm for which the upcoming event (vertical line at time zero) would be an indication of a correct vs. an incorrect guess (“future correct” or “future incorrect”). Participants performed at chance, thus there were about three times as many incorrect as correct responses. Across-participant standard error boundaries were calculated for each point and ±1 standard error of the mean (SEM) are marked with bars. (A) In the present analysis, these data would be coded with a negative sign for the effect size, because the pre- and post-event differences are in different directions (data from 54 females). (B) In the present analysis, these data would be coded with a positive sign for the effect size because the pre- and post-event differences are in the same direction (data from 30 males; note scale difference; data from Mossbridge et al., 2010). These data are not included in this meta-analysis because they arise from a post hoc analysis.

