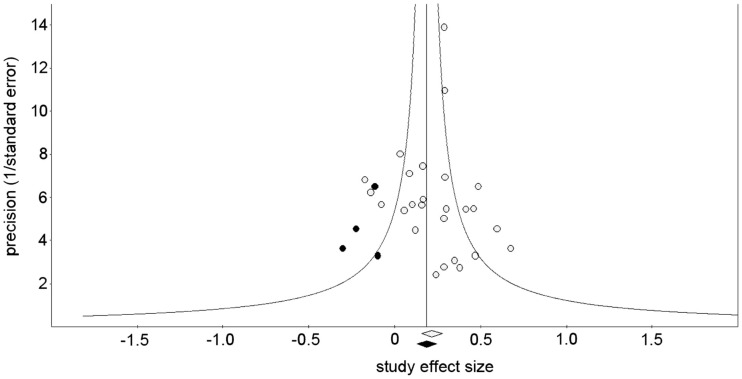
Figure 5.
Funnel plot showing the precision of the effect size estimate for each study (1/standard error) vs. the effect size of each study (open symbols), with four effect size estimates given by the trim-and-fill analysis (filled symbols). The open diamond at the base of the plot indicates the mean of the effect sizes before the trim-and-fill analysis was performed; the filled diamond indicates the mean of the effect sizes after the trim-and-fill analysis added the imputed studies.

