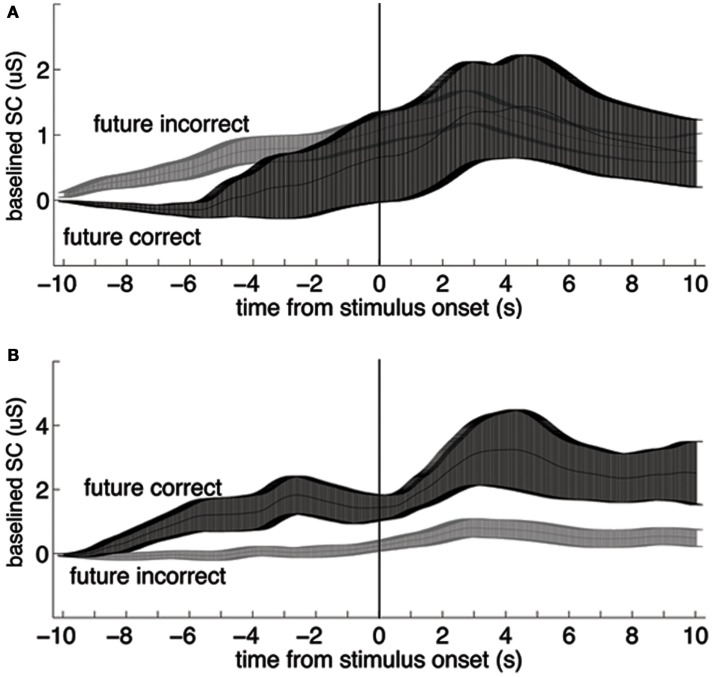
Figure 6.
Group mean traces of first trials only, from the same data set as in Figure 1. Across-participant standard error boundaries were calculated for each point and ±1 standard error of the mean (SEM) are marked with bars. (A) Data from 54 females; (B) data from 30 males. The dependent variable was the average of skin conductance during the 10-s anticipatory period. Based on this conservative method, the comparison between skin conductance values on future correct and future incorrect guesses was not significant for females (t52 = −0.59, p > 0.554), however there was no appreciable post-stimulus difference between traces for the two types of trials, so the pre-stimulus difference is not a true test of our hypothesis. The same comparison was significant for males (t28 = 4.02, p < 0.0005, d = 1.49), who also showed a large and significant post-stimulus response (note difference in scales). The sex × correctness interaction was significant (F80 = 8.90, p < 0.004, ; data from Mossbridge et al., 2010; not included in this meta-analysis because they are from a post hoc analysis within that report).

