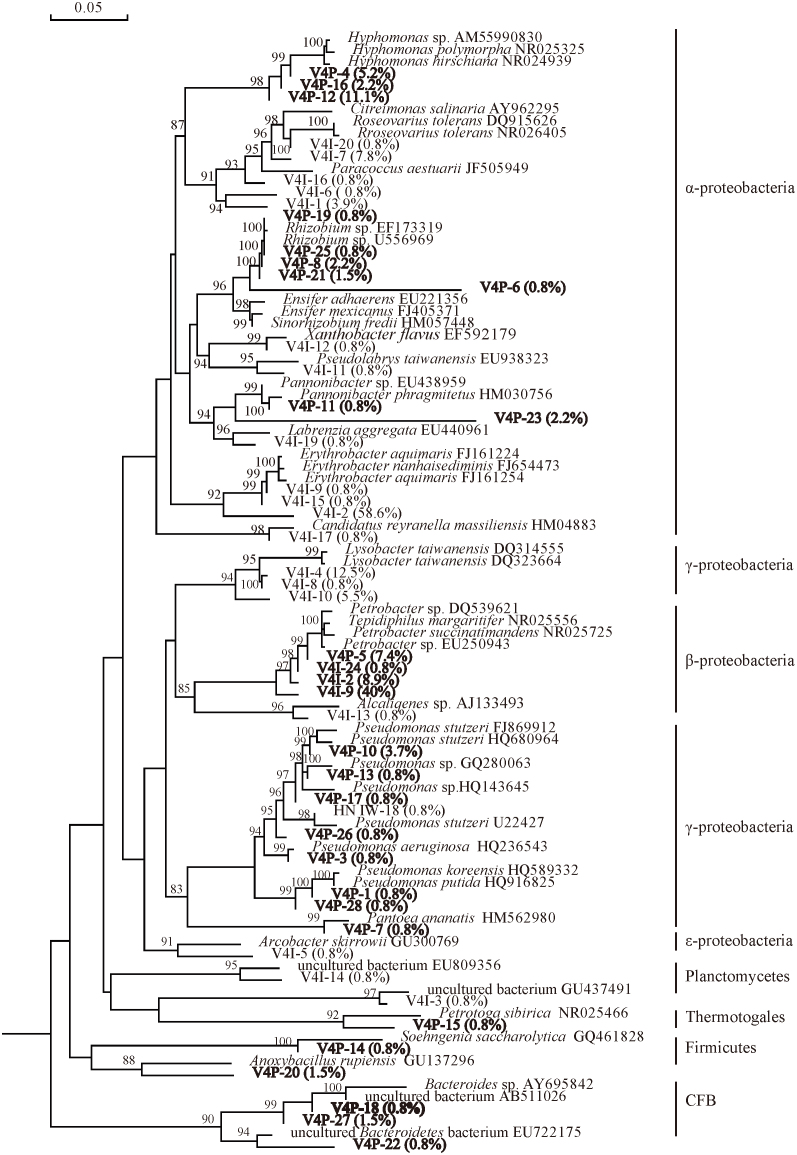
Figure 6. Phylogenetic tree of bacteria 16S rDNA phylotypes of V4I and V4P (70°C).
The tree constructed was based on approximately 800bp 16S rRNA genes and their nearest clones retrieved from the GenBank database. The percentages behind the OTUs represent the ralative abundance of each OTU. Bootstrap values are indicated at branch points. The scale bar represents 5% estimated sequence divergence.

