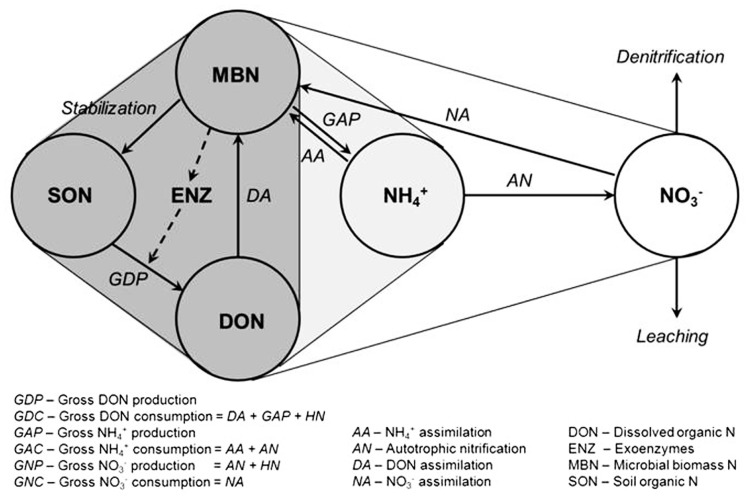
FIGURE 1.
Diagram of the microbial N cycle in aerobic soil. Major pools of N are shown in circles, major fluxes by solid arrows, and the dashed arrow represents the production of exoenzymes (e.g., proteases) for the depolymerization of soil organic N. Pools and fluxes in dark gray relate to turnover of dissolved organic N, those in light gray relate to turnover of , and unshaded to turnover of . Based on Myrold and Bottomley (2008).

