Fig. 3.
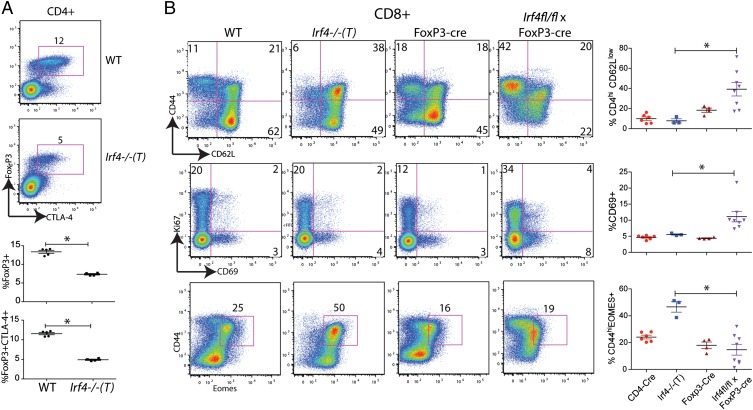
Aberrant FoxP3+ regulatory T cells in Irf4−/−(T) mice. (A) CD4+ T cells from the spleens of WT and Irf4−/−(T) mice were analyzed for intracellular FoxP3 and CTLA-4. Numbers on the dot-plots represent the percentages of CD4+ T cells that are FoxP3+CTLA-4+. Below are compilations of the percentages of CD4+ T cells that are FoxP3+ or FoxP3+CTLA-4+. Data are representative of two independent experiments. Statistical significance was determined by the Mann–Whitney test. (B) Splenic CD8+ T cells from WT, Irf4−/−(T), FoxP3-cre control, and Irf4fl/fl × FoxP3-cre mice were analyzed for expression of CD44, CD62L, CD69, Ki67, and intracellular Eomes. Dot-plots display gated CD8+TCR-β+ cells; numbers indicate the percentages of cells in the indicated quadrants or gates. (Right) Compilations of data for the four groups of mice are shown. Statistical significance was determined by the Mann–Whitney test (*P = 0.02).

