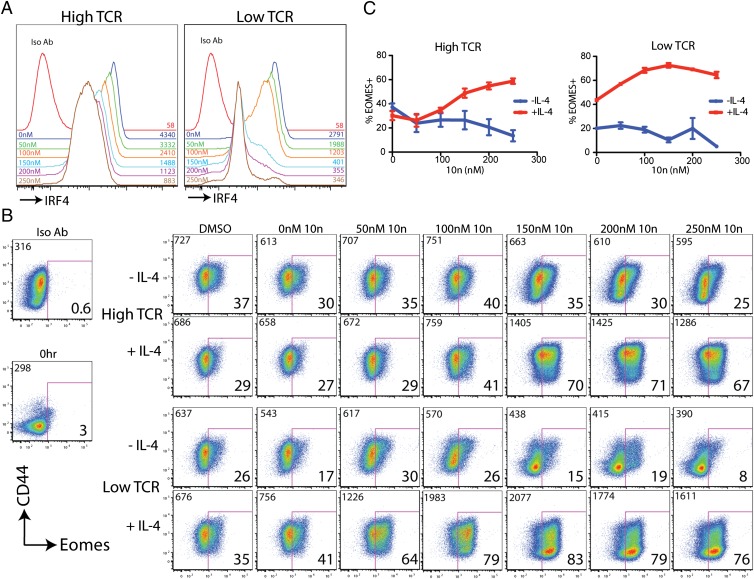
Fig. 6.
Inhibition of ITK synergizes with IL-4 to up-regulate high levels of Eomes following TCR stimulation. Naive peripheral CD8+ T cells were isolated from OT-I WT mice and were stimulated with 1 μg/mL CD3 plus 4 μg/mL CD28 (“high TCR”) or 0.1 μg/mL CD3 plus 0.4 μg/mL CD28 (“low TCR”) antibodies in the presence or absence of IL-4 (10 ng/mL) for 31 h. Cultures were supplemented with the small-molecule ITK inhibitor, 10n, at the indicated concentrations or with DMSO alone at the highest concentration used. Cells were stained with a viability dye, and antibodies to CD8, CD69, CD44, intracellular IRF4, Eomes, or isotype controls. (A) Histograms show IRF4 expression relative to the isotype control (Iso Ab). The concentrations of 10n (Left) and the MFI of IRF4 staining (Right) are indicated in each histogram. All data are from cells stimulated in high TCR (Left) or Low TCR (Right) in the absence of exogenous IL-4. (B) Dot-plots show Eomes vs. CD44 staining in cells stimulated with high TCR (Upper two rows) or low TCR (Lower two rows) and supplemented with IL-4 or 10n as indicated. Numbers at the upper left of each dot-plot indicate the MFI of Eomes staining. Numbers at the lower right of each dot-plot indicate the percentage of Eomes+ cells. Data are representative of four experiments. (C) Compilations of data indicate percentages of Eomes+ cells for each condition.

