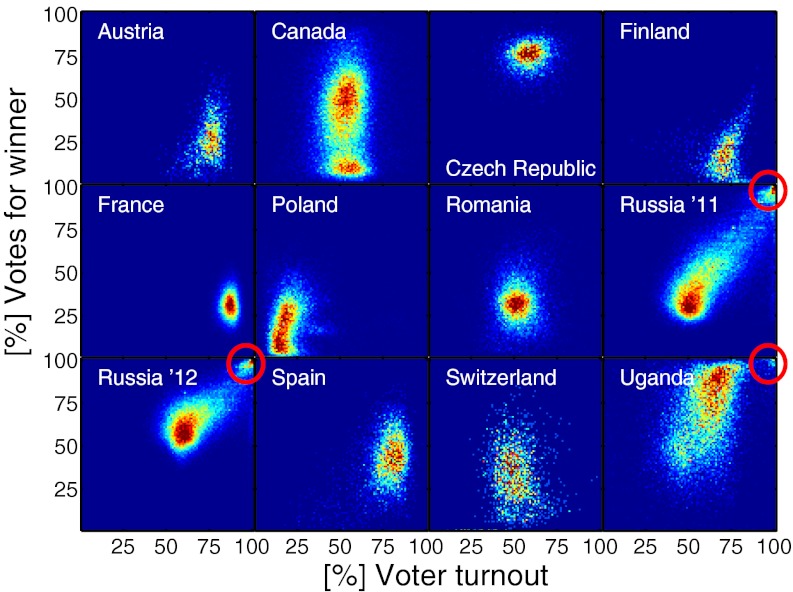
Fig. 1.
Election fingerprints. Two-dimensional histograms of the number of units for a given voter turnout (x axis) and the percentage of votes (y axis) for the winning party (or candidate) in recent elections from different countries (Austria, Canada, Czech Republic, Finland, France, Poland, Romania, Russia 2011, Russia 2012, Spain, Switzerland, and Uganda) are shown. Color represents the number of units with corresponding vote and turnout numbers. The units usually cluster around a given turnout and vote percentage level. In Uganda and Russia, these clusters are smeared out to the upper right region of the plots, reaching a second peak at a 100% turnout and 100% of votes (red circles). In Canada, there are clusters around two different vote values, corresponding to the Québécois and English Canada (SI Text). In Finland, the main cluster is smeared out into two directions (indicative of voter mobilization because of controversies surrounding the True Finns).

