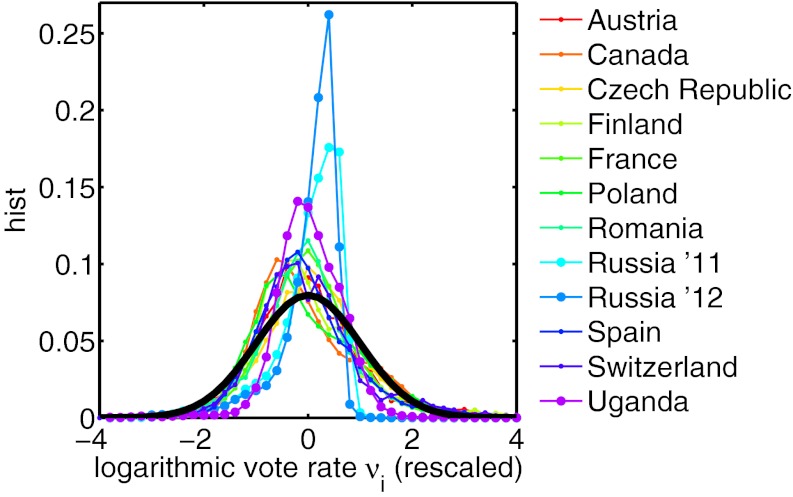
Fig. 2.
A simple way to compare data from different elections in different countries on a similar aggregation level is to present the distributions of the logarithmic vote rates νi of the winning parties as rescaled distributions with zero mean and unit variance (24). Large deviations from other countries can be seen for Uganda and Russia with the plain eye. More detailed results are found in Table S3.

