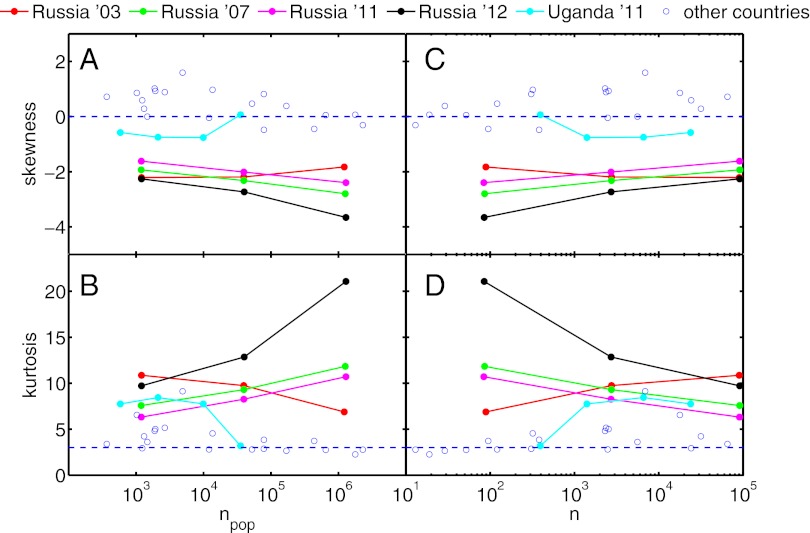
Fig. 3.
For each country on each aggregation level, skewness and kurtosis of the logarithmic vote rate distributions are shown as a function of the average electorate per unit  in A and B, respectively, and as a function of the number of units n in C and D. Results for Russia and Uganda are highlighted. The values for all other countries cluster around zero and three, which are the values expected for normal distributions. On the largest aggregation level, election data from Uganda and Russia cannot be distinguished from other countries.

