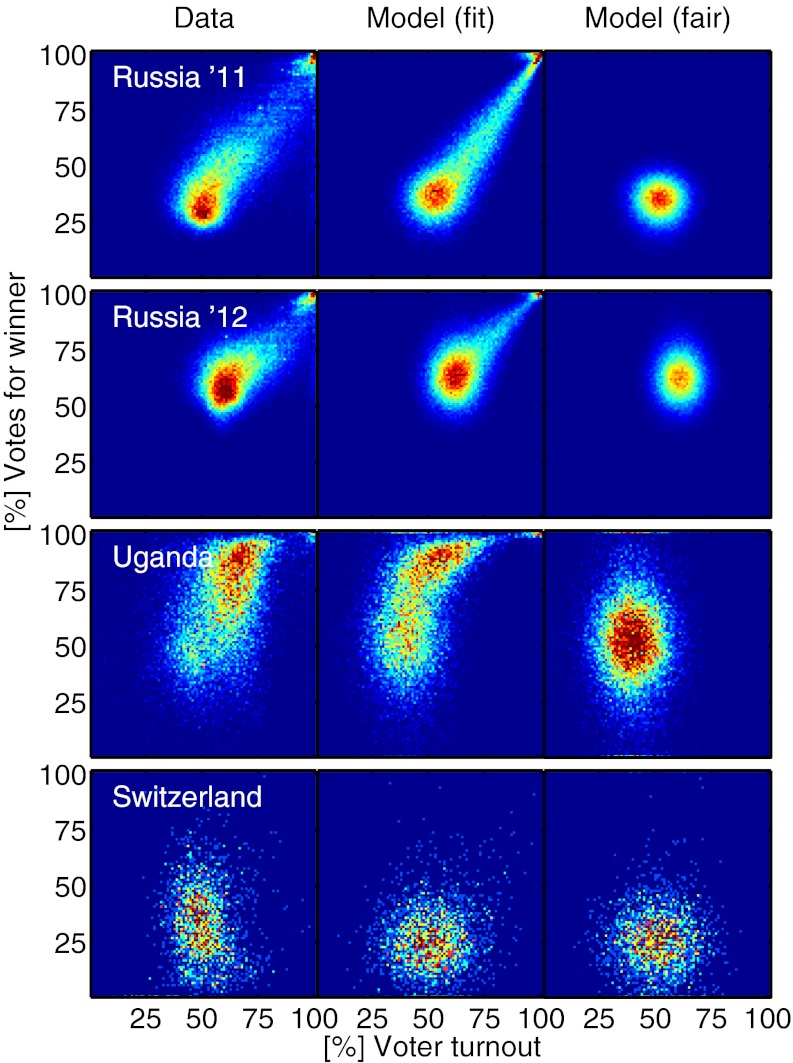
Fig. 4.
Comparison of observed and modeled vtds for Russia 2011, Russia 2012, Uganda, and Switzerland. Left shows the observed election fingerprints. Center shows a fit with the fraud model. Right shows the expected model outcome of fair elections (i.e., absence of fraudulent mechanisms fi = fe = 0). For Switzerland, the fair and fitted models are almost the same. The results for Russia and Uganda can be explained by the model assuming a large number of fraudulent units.

