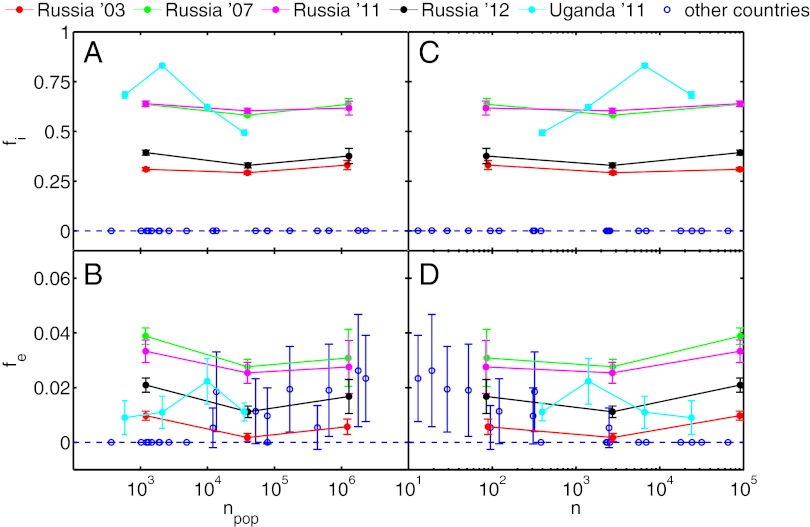
Fig. 5.
For each country on each aggregation level, the values for fi and fe as given in Table S3 are shown as a function of the average electorate per unit  in A and B, and for the number of units n in C and D, respectively. Results for Russia and Uganda are highlighted. The values for all other countries are close to zero, indicating that the data are best described by the absence of the ballot stuffing mechanism. Parameter values for fi and fe for Russia and Uganda remain significantly above zero for all aggregation levels. Note that, in D, the error margins for fe values in the range 10 < n < 100 (as well as for the corresponding values fe in C) get increasingly large, whereas fi estimates in this range stay robust.

