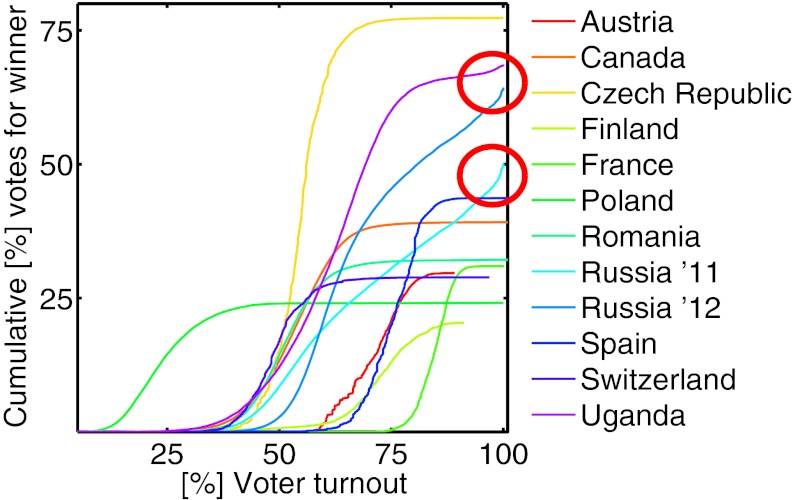
Fig. 6.
The ballot stuffing mechanism can be visualized by considering the cumulative number of votes as a function of turnout. Each country’s election winner is represented by a curve, which typically takes the shape of a sigmoid function reaching a plateau. In contrast to the other countries, Russia and Uganda do not tend to develop this plateau but instead, show a pronounced increase (boost) close to complete turnout. Both irregularities are indicative of the two ballot stuffing modes being present.

