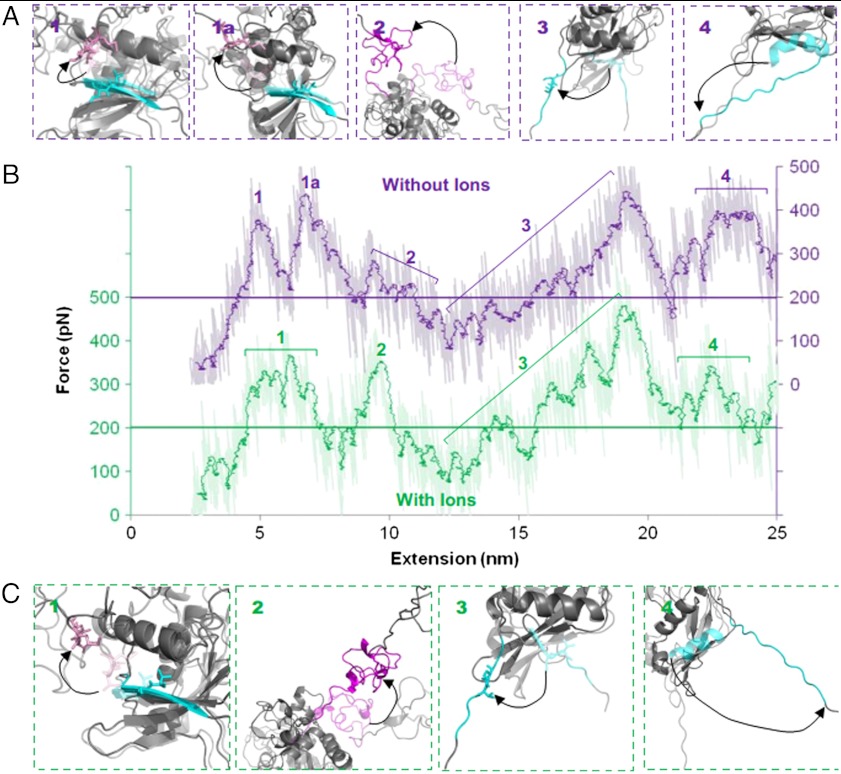
Fig. 4.
Force-extension output from MD simulations comparing differences in the unfolding profile of the LNR-HD region in the presence and absence of ions. Force-extension graphs (B) comparing the absence (purple) and presence (green) of ions are staggered by 300 pN. The horizontal line dissecting the plots highlights the 200 pN point on both curves, raw data shown as well as a running average (period: 50). Screenshots for each highlighted peak are shown for simulations in the absence (A) and presence (C) of coordinated ions. Structure before unfolding peak is shown semitransparent and main features highlighted with color; arrows show key changes. Data generated from GROMACS 4.5.3; images created in PyMol (version 1.3).

