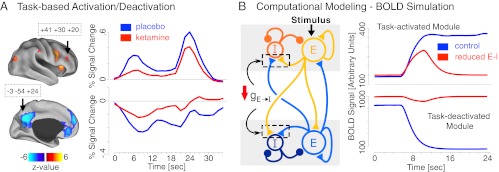
Fig. 3.
(A) Regions exhibiting WM effects and modulation of this effect by ketamine for task-based activation (Upper) and task-based deactivation (Lower). WM time courses are shown for dorso-lateral prefrontal cortex (Upper) and precuneus (Lower) for ketamine (red) and placebo (blue) (coordinates are shown in boxes). Complete list of foci exhibiting significant effects across encoding and delay phases is presented in Table S4 and Fig. S2. The probe phase analysis did not reveal significant modulation by ketamine. Note: less negative value for DMN under ketamine reflects less deactivation relative to baseline compared with the placebo condition. (B) Computational model scheme, comprised of task-activated (Upper) and task-deactivated (Lower) modules followed by modeling results. We modeled the effects of ketamine as a reduction of NMDA conductance onto inhibitory interneurons (gE-I). We examined whether “disinhibition” via reduced NMDA conductance onto GABA cells (E-I) would result in effects similar to BOLD findings under ketamine. Here, we present predicted BOLD signal derived from the simulated local field potential (LFP) on the time scale comparable to a single WM trial in the experiment to appropriately juxtapose model simulations to BOLD empirical observations. For complete modeling implementation, BOLD simulation details, and comparison with firing-rate results, see SI Text, Computational Modeling and Figs. S4–S6.

