Fig. 2.
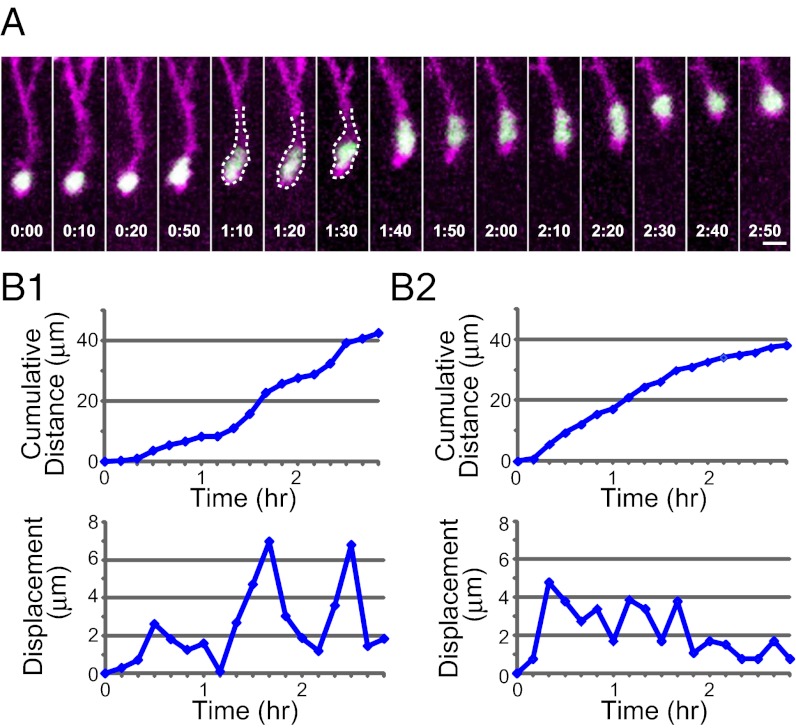
Nucleokinesis of interneurons. (A) Time-lapse sequence of nucleokinesis. Interneurons were labeled by coelectroporation of nls–EGFP (green) and GAP-tdTomato (magenta). The dashed lines partially outline the cell body. Elapsed time is indicated at the bottom of each image (h:min). (B) The cumulative distance (Upper) and displacement at each step (Lower) of the two migrating neurons are plotted against time. B1 corresponds to the neuron shown in A. Although displacement in each step in B2 was not constant, saltatoriness was not obvious. (Scale bar, 10 μm.)

