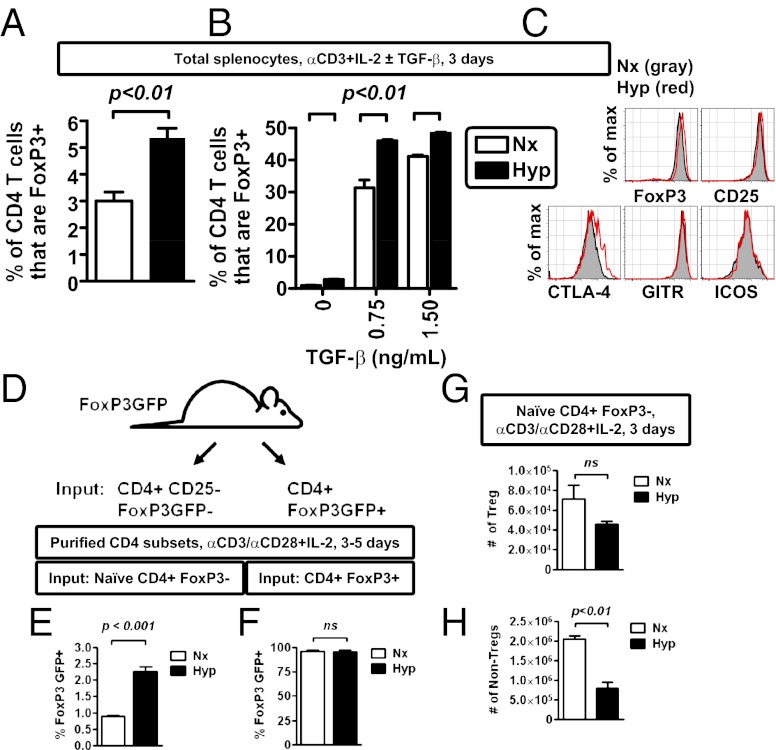
Fig. 3.
Hypoxia enhances the relative abundance of Tregs after in vitro activation. (A) Hypoxia enhances the frequency of FoxP3+ CD4 T cells after in vitro stimulation of primary mouse CD4 T cells with soluble anti-CD3 antibody (1 μg/mL) in bulk splenocyte culture, comparing cells cultured in normoxia (Nx, white bar) or hypoxia (Hyp, black bar). (B) Hypoxia enhances the frequency of FoxP3+ CD4 T cells after in vitro stimulation of primary mouse CD4 T cells with soluble anti-CD3 antibody (1 μg/mL), IL-2, and TGF-β1 in bulk splenocyte culture, comparing cells cultured in normoxia (Nx, white bar) or hypoxia (Hyp, black bar). (C) Flow cytometric analysis of protein expression within FoxP3+ CD4 T cells after 3 d of stimulation in hypoxia (red line) or normoxia (gray shading). (D) Experimental scheme to test the effect of hypoxia on the induction of FoxP3 expression in different T-cell subsets (Tregs vs. non-Tregs). (E and F) Hypoxia enhances de novo FoxP3 expression in non-Tregs (E), while having no effect on the relative abundance of existing Tregs (F). CD4 T cells fom FoxP3-GFP mice were sorted either as CD25-negative Foxp3GFP-negative (non-Tregs) or Foxp3GFP-positive cells (Tregs) and then stimulated with anti-CD3/CD28 microbeads and IL-2 for 3–5 d in either normoxia or hypoxia. Viable CD4 T cells were then analyzed for expression FoxP3 GFP by flow cytometry, with data depicting mean ± SEM for three to six replicate cultures, from two independent experiments. (G and H) Absolute cell counts for either Tregs (G) or non-Tregs (H) following stimulation of naive CD4, FoxP3− cells isolated from FoxP3GFP mice with anti-CD3/CD28 microbeads and IL-2 for 3 d in either normoxia or hypoxia. CD4 T cells were defined as viable, MHC class II negative, CD4+ events by flow cytometry, which were either FoxP3+ (Tregs, in G) or FoxP3− (non-Tregs, in H), with data depicting mean ± SEM for nine replicate cultures, from two independent experiments. All plots show mean ± SEM representative of two to four independent experiments, with flow cytometric results from a minimum of triplicate cultures (A and B), and include statistical significance calculated by unpaired t test.

